empty
27.02.2020 12:48 AM
GBP/USD. Results of February 26. European Commission President Ursula von der Leyen: EU ready to start negotiations with Great Britain

4-hour timeframe

This image is no longer relevant

Amplitude of the last 5 days (high-low): 115p - 80p - 105p - 68p - 104p.

Average volatility over the past 5 days: 95p (average).

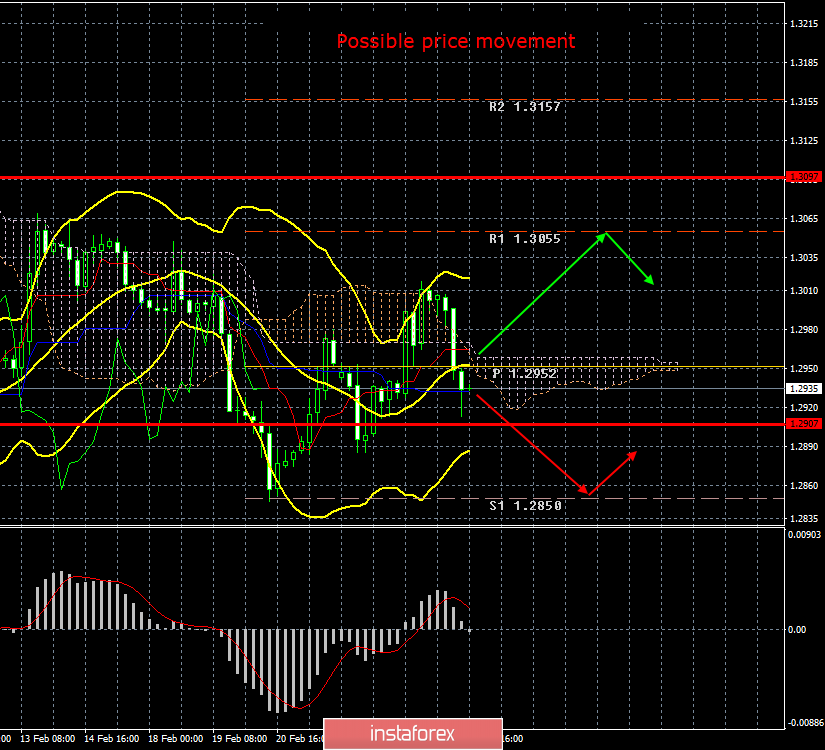
The GBP/USD currency pair continues to trade in different directions. After the pound/dollar pair rose to the upper boundary of the Ichimoku cloud on Tuesday, a downward reversal and a rather strong fall of the British currency followed today. At the moment, the pair is trading even below the Kijun-sen critical line, overcoming which will change the current trend from upward to downward. However, on the whole, the swing continues without a pronounced tendency. If earlier the pound often refused to react to the fundamental and macroeconomic background, so that we even started thinking about the paradoxical situation for the pound, now there is simply no macroeconomic background. No important messages were received from the UK, no economic reports were published in the first three trading days of the week. It's impossible to even say that the pound is currently traded on pure technology, since the "swing" cannot be technically justified only if it is not a pronounced flat. However, there is no flat now. Therefore, we now have a simply completely unpredictable, non-trending, non-phletic movement, which has no fundamental justification. In this situation, each trader decides whether to trade this pair or not.

In the meantime, from time to time, traders are informed about future trade negotiations between London and Brussels. So far, they have no significance, since the negotiations themselves have not yet begun. For example, today the head of the European Commission, Ursula von der Leyen, announced her readiness to begin negotiations with London. Judge for yourself, dear traders, how important this message is. "Negotiations with Great Britain will begin on March 2. We are ready to build a close relationship with an ambitious partnership with the UK. It's good for people and business," von der Leyen wrote on her Twitter. Information that negotiations will begin in early March has been known for a long time. Moreover, the European Council just the other day adopted a mandate, according to which negotiations will be held with London, Michel Barnier and his group of diplomats. In general, this news is not news at all.

We continue to insist that the British currency ignores the general negative fundamental background. We believe that the pound should form a new downward trend a long time ago, since there are very few prospects for concluding an EU-Britain trade deal. Especially with such a prime minister as Boris Johnson, who decided to negotiate with everyone in the style of Donald Trump, that is, from the standpoint of his own benefit and strength. That's just Britain - not the United States. America has the strongest economy in the world, and the British economy has stalled very much in recent years. Boris Johnson, with his integrity and inability to negotiate, can only finish off the British economy.

From a technical point of view, there is now a correction against the Golden Cross. Thus, a rebound in the price from the Kijun-sen line may trigger a new round of upward movement.

Trading recommendations:

GBP/USD has started a new round of correction against a correction or an upward trend. Thus, selling the British pound with the target of 1.2850 is now recommended no earlier than the return of quotes below the critical line. We recommend that you consider buying the pair with a target of 1.3055 in small lots if the bulls stay above the Kijun-sen line. The fundamental background still does not support the pound.

Explanation of the illustration:

Ichimoku indicator:

Tenkan-sen is the red line.

Kijun-sen is the blue line.

Senkou Span A - light brown dotted line.

Senkou Span B - light purple dashed line.

Chikou Span - green line.

Bollinger Bands Indicator:

3 yellow lines.

MACD indicator:

Red line and bar graph with white bars in the indicators window.

Support / Resistance Classic Levels:

Red and gray dashed lines with price symbols.

Pivot Level:

Yellow solid line.

Volatility Support / Resistance Levels:

Gray dotted lines without price designations.

Possible price movements:

Red and green arrows.

Paolo Greco,
الخبير التحليلي لدى شركة إنستافوركس
© 2007-2025
حدد الإطار الزمني
5
د
15
د
30
د
1
س
4
ساعات
1
يوم
1
أسبوع
كسب عائد من تغيرات أسعار العملات المشفرة مع إنستافوركس.
قم بتحميل منصة التداول ميتاتريدر 4 وافتح أول صفقة.
  • Grand Choice
    Contest by
    InstaForex
    InstaForex always strives to help you
    fulfill your biggest dreams.
    انضم إلى المسابقة

المقالات الموصى بها

تحليل مؤشر سحابة إيتشيموكو على الذهب ليوم 30 نوفمبر 2023.

سعر الذهب يتداول حول 2034 دولارًا. الاتجاه القصير الأجل وفقًا لمؤشر السحابة إيتشيموكو في الرسم البياني اليومي لا يزال صاعدًا. السعر فوق السحابة (الغيمة) وحتى الآن لا يوجد أي علامة

Alexandros Yfantis 21:52 2023-11-30 UTC+2

تحليل مؤشر سحابة إيتشيموكو على زوج اليورو/الدولار الأمريكي ليوم 29 نوفمبر 2023.

يتداول زوج اليورو/الدولار الأمريكي حول 1.0980. من حيث سحابة إيتشيموكو، يظل الاتجاه صاعدًا. حقق زوج اليورو/الدولار الأمريكي أعلى مستوى عند 1.1017 وانخفض لاختبار دعم الخط الأحمر (مؤشر التنكان-سين) عند 1.0976

Alexandros Yfantis 13:33 2023-11-29 UTC+2

تحليل مؤشر سحابة إيتشيموكو على زوج اليورو/الدولار الأمريكي ليوم 28 نوفمبر 2023.

يتداول زوج اليورو/الدولار الأمريكي حوالي 1.0950. من حيث سحابة إيتشيموكو في الرسم البياني للأربع ساعات، يظل الاتجاه صاعدًا حيث يستمر السعر في البقاء فوق السحابة (الغيمة). يظل الشيكو سبان (مؤشر

Alexandros Yfantis 14:41 2023-11-28 UTC+2

تحليل مؤشر سحابة إيتشيموكو على زوج العملات USDJPY في 28 نوفمبر 2023.

يتداول زوج الدولار الأمريكي/الين الياباني حوالي 148.43. من حيث سحابة إيتشيموكو، فإن الاتجاه الآن محايد حيث دخل السعر السحابة اليومية. هذا يعتبر علامة على الضعف. لم يتمكن السعر من الارتفاع

Alexandros Yfantis 14:37 2023-11-28 UTC+2

تحليل مؤشر سحابة إيتشيموكو على الذهب ليوم 27 نوفمبر 2023.

سعر الذهب يتداول فوق 2010 دولار ويحقق ذروات جديدة أعلى بالمقارنة مع ذروة أكتوبر. من حيث سحابة إيتشيموكو، الاتجاه لا يزال صاعدًا. سعر الذهب يفوق بكثير الكومو (السحابة). خط التنكان-سين

Alexandros Yfantis 14:57 2023-11-27 UTC+2

تحليل مؤشر سحابة إيتشيموكو على زوج اليورو/الدولار الأمريكي ليوم 27 نوفمبر 2023.

يتداول زوج اليورو/الدولار الأمريكي حوالي 1.0950. في الرسم البياني للأربع ساعات، يتداول السعر فوق سحابة إيتشيموكو (صعودي). يكون شيكو سبان (مؤشر الخط الأسود) فوق نمط الشموع (صعودي)، في حين يوفر

Alexandros Yfantis 14:53 2023-11-27 UTC+2

تحليل مؤشر سحابة إيتشيموكو على زوج الدولار الأمريكي/الين الياباني ليوم 27 نوفمبر 2023.

يتداول زوج الدولار الأمريكي/الين الياباني حوالي 148.80. اليوم ، يقترب السعر كثيرًا من دخول الغيمة اليومية (السحابة) وتحويل الاتجاه من صعودي إلى محايد. ارتد السعر من دعم الغيمة واختبر

Alexandros Yfantis 14:49 2023-11-27 UTC+2

تحليل مؤشر سحابة إيتشيموكو على الذهب ليوم 24 نوفمبر 2023.

سعر الذهب يتداول مرة أخرى حول 2000 دولار. الاتجاه القصير الأجل لا يزال صاعدًا حيث يظل السعر فوق دعم الكومو (السحابة). يظل شيكو سبان (مؤشر الخط الأسود) فوق نمط الشموع

Alexandros Yfantis 16:27 2023-11-24 UTC+2

تحليل مؤشر سحابة إيتشيموكو على زوج العملات اليورو/الدولار الأمريكي ليوم 24 نوفمبر 2023.

يتداول زوج اليورو/الدولار الأمريكي حول 1.0936. من حيث سحابة إيتشيموكو، يظل الاتجاه صاعدًا في المدى القريب حيث يستمر السعر في التداول فوق الكومو (السحابة). يظل الشيكو سبان (مؤشر الخط الأسود)

Alexandros Yfantis 16:24 2023-11-24 UTC+2

تحليل مؤشر سحابة إيتشيموكو على زوج العملات USDJPY ليوم 23 نوفمبر 2023.

يتداول زوج الدولار الأمريكي/الين الياباني حوالي 149.62. انخفض السعر نحو الغيمة اليومية ووجد دعمًا. السعر الآن يرتد من الدعم الذي يقدمه الغيمة نحو خط الكيجون-سين (مؤشر الخط الأصفر) وخط التنكان-سين

Alexandros Yfantis 16:21 2023-11-23 UTC+2
لا تستطيع التحدث الآن؟
اطرح سؤالك في الدردشة.
Widget callback
 

Dear visitor,

Your IP address shows that you are currently located in the USA. If you are a resident of the United States, you are prohibited from using the services of InstaFintech Group including online trading, online transfers, deposit/withdrawal of funds, etc.

If you think you are seeing this message by mistake and your location is not the US, kindly proceed to the website. Otherwise, you must leave the website in order to comply with government restrictions.

Why does your IP address show your location as the USA?

  • - you are using a VPN provided by a hosting company based in the United States;
  • - your IP does not have proper WHOIS records;
  • - an error occurred in the WHOIS geolocation database.

Please confirm whether you are a US resident or not by clicking the relevant button below. If you choose the wrong option, being a US resident, you will not be able to open an account with InstaForex anyway.

We are sorry for any inconvenience caused by this message.