empty
27.01.2022 12:00 PM
Technical analysis recommendations of EUR/USD and GBP/USD on January 27, 2022

EUR/USD

This image is no longer relevant

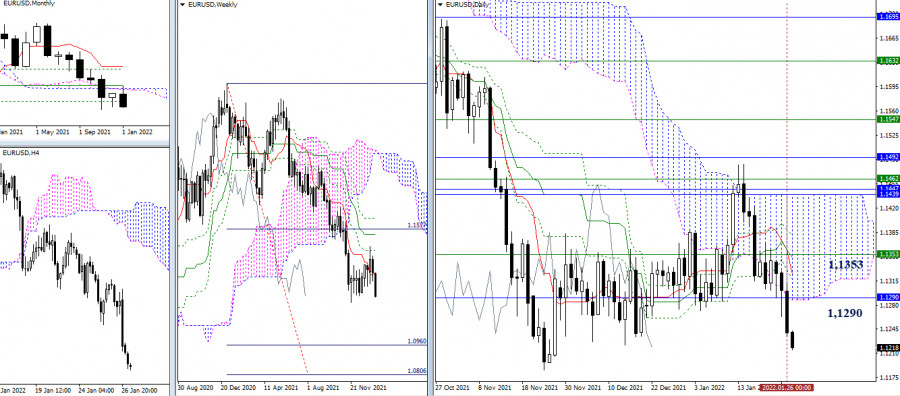
The bears implemented a decline. Now, their interests are focused on breaking through the minimum extreme (1.1186) and restoring the weekly downward trend. After that, attention can be directed again to the breakdown of the weekly downside target for the breakdown of the Ichimoku cloud (1.0806 - 1.0960). The levels of 1.1353 - 1.1290 (weekly short-term trend + final level of the monthly cross + daily levels), which we managed to break yesterday, still remain important. They still exert their influence and attraction on the situation.

This image is no longer relevant

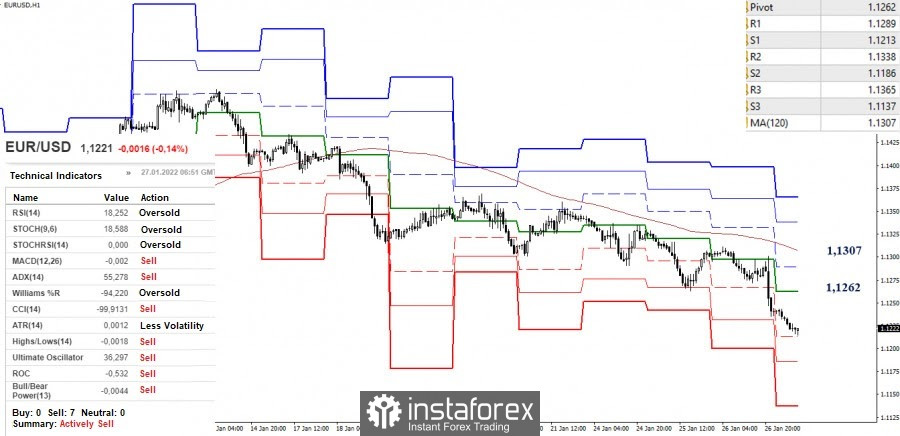
The upward corrections during the previous days could not take away the main advantage from the bears, who continue to dominate and update new lows. As they further decline, they have reached the first support of the classic pivot levels (1.1213). The next support points are set at S2 (1.1186) and S3 (1.1137). The key levels in the smaller timeframes currently act as resistance, so they can come into operation with the development of the next upward correction. The key levels are now located at 1.1262 (central pivot level) and 1.1307 (weekly long-term trend).

GBP/USD

This image is no longer relevant

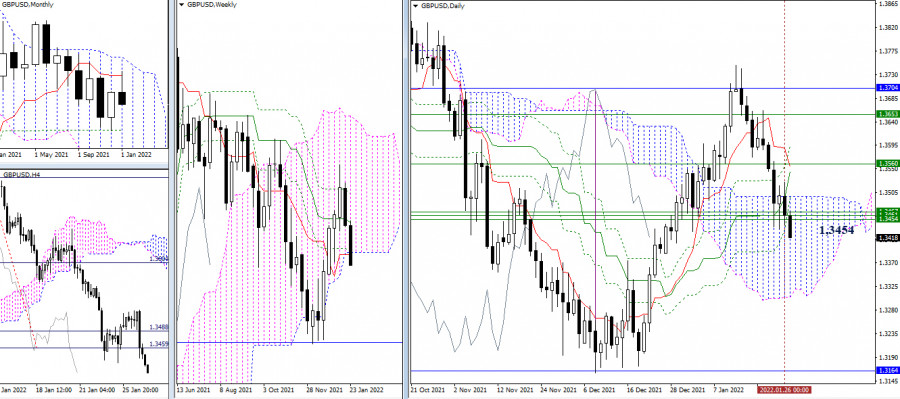
Yesterday, the bulls failed to implement the emerging rebound. The pair returned to the support level of 1.3454 (accumulation of weekly levels) and try to break through it again. The downward pivot points here now include 1.3304 (lower border of the daily cloud) and 1.3164 (monthly Fibo Kijun).

This image is no longer relevant

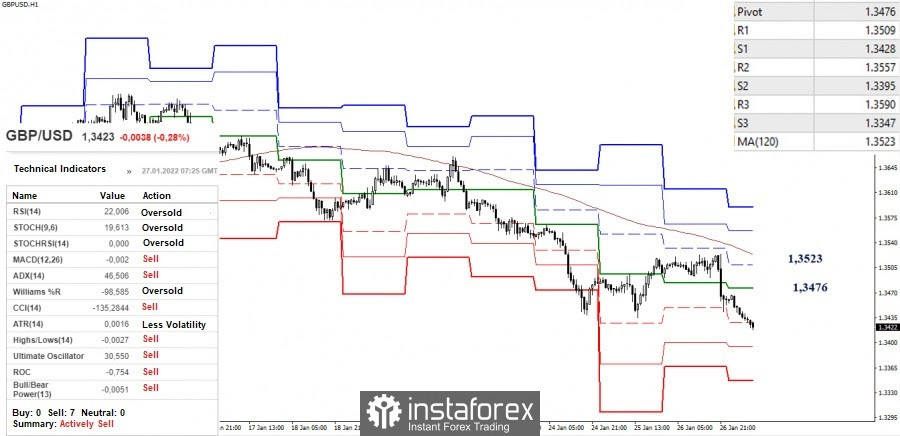
The correction ended in the smaller timeframes with the bears having the advantage. They are back in a downward trend. At the moment, S1 (1.3428) is being tested. The next pivot points for the intraday decline are the support of the classic pivot levels of 1.3395 (S2) and 1.3347 (S3), while the key levels responsible for the balance of power are seen at 1.3476 (central pivot level) and 1.3523 (weekly long-term trend). A consolidation above and reversal of the moving average can affect the current balance of forces.

***

Ichimoku Kinko Hyo (9.26.52) and Kijun-sen levels in the higher time frames, as well as classic Pivot Points and Moving Average (120) on the H1 chart, are used in the technical analysis of the trading instruments.

Evangelos Poulakis,
الخبير التحليلي لدى شركة إنستافوركس
© 2007-2025
حدد الإطار الزمني
5
د
15
د
30
د
1
س
4
ساعات
1
يوم
1
أسبوع
كسب عائد من تغيرات أسعار العملات المشفرة مع إنستافوركس.
قم بتحميل منصة التداول ميتاتريدر 4 وافتح أول صفقة.
  • Grand Choice
    Contest by
    InstaForex
    InstaForex always strives to help you
    fulfill your biggest dreams.
    انضم إلى المسابقة

المقالات الموصى بها

إشارات التداول لليورو/الدولار الأمريكي للفترة من 24 إلى 26 أبريل 2025: بيع تحت 1.1435 (21 SMA - 7/8 Murray)

في بداية الجلسة الأمريكية، يتداول زوج اليورو/الدولار الأمريكي حول مستوى 1.1358 داخل قناة الاتجاه الهابط التي تشكلت في 18 أبريل. الزوج تحت ضغط بيعي. نعتقد أن الأداة لديها طريق طويل

Dimitrios Zappas 17:06 2025-04-24 UTC+2

توقعات الفوركس 24/04/2025: اليورو/الدولار الأمريكي، الجنيه الإسترليني/الدولار الأمريكي، SP500، الذهب والبيتكوين

روابط مفيدة: مقالاتي الأخرى متوفرة في هذا القسم دورة InstaForex للمبتدئين التحليلات الشائعة افتح حساب تداول مهم: يجب على المبتدئين في تداول الفوركس أن يكونوا حذرين للغاية عند اتخاذ القرارات

Sebastian Seliga 13:25 2025-04-24 UTC+2

الذهب. قد تنخفض أسعار الذهب بشكل كبير في المستقبل القريب

شهدت أسعار الذهب مؤخرًا تصحيحًا ملحوظًا وسط توقعات السوق ببدء مفاوضات حقيقية بين الولايات المتحدة والصين بشأن التعريفات التجارية والتجارة بشكل عام. يشير تصريح وزير الخزانة س. بيسنت، الذي أشار

Pati Gani 09:38 2025-04-24 UTC+2

التحليل الفني لحركة سعر أداة سلعة الفضة، الخميس 24 أبريل 2025.

على الرسم البياني لمدة 4 ساعات، يظهر أداة سلعة الفضة حتى وإن كانت حالتها تتقوى، حيث يتم تأكيد ذلك من خلال حركة سعر الفضة التي تتحرك فوق WMA (30 Shift

Arief Makmur 06:18 2025-04-24 UTC+2

التحليل الفني لحركة سعر مؤشر ناسداك 100، الخميس 24 أبريل 2025.

على الرغم من أن مؤشر ناسداك 100 على الرسم البياني لمدة 4 ساعات يتحرك بشكل جانبي، إلا أن النطاق واسع بما يكفي ليظل هناك فرصة واعدة في المؤشر. حاليًا، مؤشر

Arief Makmur 06:18 2025-04-24 UTC+2

إشارات التداول للذهب (XAU/USD) للفترة من 23 إلى 25 أبريل 2025: البيع تحت مستوى $3,333 (200 EMA - 6/8 Murray)

في وقت مبكر من الجلسة الأمريكية، كان الذهب يتداول عند حوالي 3,333 ضمن قناة الاتجاه الهابط التي تشكلت في 22 أبريل. يظهر زوج XAU/USD علامات على التشبع البيعي ويرتد

Dimitrios Zappas 14:31 2025-04-23 UTC+2

التحليل الفني لحركة السعر اللحظية لأزواج العملات المتقاطعة AUD/JPY، الأربعاء، 23 أبريل 2025.

مع ظهور تباين بين حركة سعر زوج العملات المتقاطع AUD/JPY مع مؤشر مذبذب ستوكاستيك وحركة سعر AUD/JPY التي تقع فوق المتوسط المتحرك المرجح (30 إزاحة 2) والذي لديه أيضًا

Arief Makmur 06:37 2025-04-23 UTC+2

التحليل الفني لحركة السعر اليومية لأداة سلعة الذهب، الأربعاء، 23 أبريل 2025.

إذا نظرنا إلى الرسم البياني لمدة 4 ساعات، يبدو أن أداة السلع الذهبية لا تزال تتحرك في اتجاه صعودي، ولكن مع ظهور تباين بين حركة سعر الذهب ومؤشر مذبذب ستوكاستيك،

Arief Makmur 06:37 2025-04-23 UTC+2

توقعات الفوركس 22/04/2025: اليورو/الدولار الأمريكي، الجنيه الإسترليني/الدولار الأمريكي، الدولار الأمريكي/الين الياباني وبيتكوين

روابط مفيدة: مقالاتي الأخرى متوفرة في هذا القسم دورة InstaForex للمبتدئين التحليلات الشائعة افتح حساب تداول مهم: يجب على المبتدئين في تداول الفوركس أن يكونوا حذرين للغاية عند اتخاذ القرارات

Sebastian Seliga 10:08 2025-04-22 UTC+2

التحليل الفني لحركة السعر اللحظية لأزواج العملات المتقاطعة GBP/CHF، الثلاثاء 22 أبريل 2025.

إذا نظرنا إلى الرسم البياني لمدة 4 ساعات لزوج العملات المتقاطع GBP/CHF، نجد عدة حقائق مثيرة للاهتمام. أولاً، ظهور نمط المثلث متبوعًا بحركة المتوسط المتحرك الأسي (21) الذي يتحرك

Arief Makmur 06:58 2025-04-22 UTC+2
لا تستطيع التحدث الآن؟
اطرح سؤالك في الدردشة.
Widget callback
 

Dear visitor,

Your IP address shows that you are currently located in the USA. If you are a resident of the United States, you are prohibited from using the services of InstaFintech Group including online trading, online transfers, deposit/withdrawal of funds, etc.

If you think you are seeing this message by mistake and your location is not the US, kindly proceed to the website. Otherwise, you must leave the website in order to comply with government restrictions.

Why does your IP address show your location as the USA?

  • - you are using a VPN provided by a hosting company based in the United States;
  • - your IP does not have proper WHOIS records;
  • - an error occurred in the WHOIS geolocation database.

Please confirm whether you are a US resident or not by clicking the relevant button below. If you choose the wrong option, being a US resident, you will not be able to open an account with InstaForex anyway.

We are sorry for any inconvenience caused by this message.