empty
07.03.2025 02:18 PM
Forecast for EUR/USD on March 7, 2025

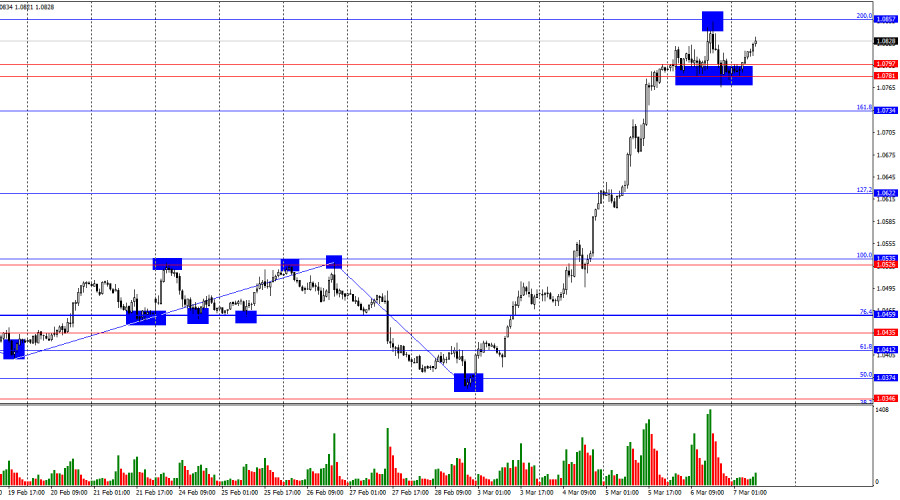
On Thursday, EUR/USD continued its upward movement, reaching the 200.0% Fibonacci retracement level at 1.0857. A rebound from this level favored a return to the support zone of 1.0781–1.0797. A rebound from this area would suggest a resumption of growth toward 1.0857. If the pair consolidates above 1.0857, the likelihood of further gains toward 1.0944 will increase.

This image is no longer relevant

The wave structure on the hourly chart has shifted. The last completed downward wave broke the previous low, while the new upward wave has exceeded the prior peak. This confirms a bullish trend, dismissing the notion of horizontal movement. However, the current uptrend is impulsive, driven mainly by fears of a U.S. economic slowdown due to Trump's policies. This remains the primary reason for the dollar's decline this week.

On Thursday, the market once again ignored fundamental data that could have supported dollar bulls. The ECB's policy decision was dovish, as the European regulator further eased monetary policy. However, some hawkish elements were present, as Christine Lagarde hinted at a potential pause in further rate cuts. Yet, she clarified that this pause would be contingent on economic conditions. If the economy grows and inflation continues to decline, additional rate cuts may not be necessary.

However, it remains unclear how the European economy can grow when Donald Trump is preparing to impose tariffs on European imports. Additionally, how can inflation decline when already-implemented tariffs could fuel inflation worldwide? While we are not talking about a major surge in global inflation, it is worth noting that neither the Bank of England, the Fed, nor the ECB has yet managed to bring inflation down to 2%. Thus, I see no reason for the ECB to halt its rate cuts for now.

This image is no longer relevant

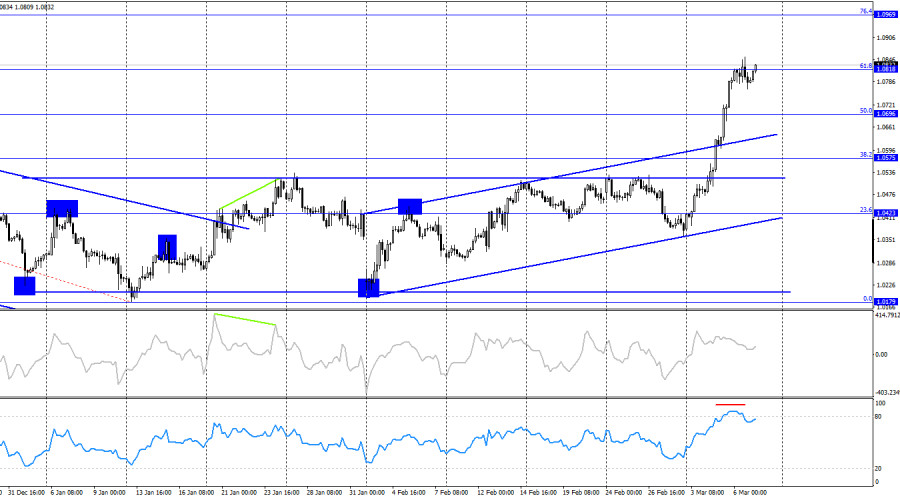
On the 4-hour chart, the pair has broken above the horizontal range, confirming a bullish trend. The upward trend channel remains intact, with prices breaking key resistance levels one after another. No divergence signals are forming today.

The euro's rally is fueled almost entirely by Trump's policy decisions, but today, a series of important economic events are scheduled. The dollar still has chances for a rebound, though market interest in the U.S. currency remains extremely low.

Commitments of Traders (COT) Report

This image is no longer relevant

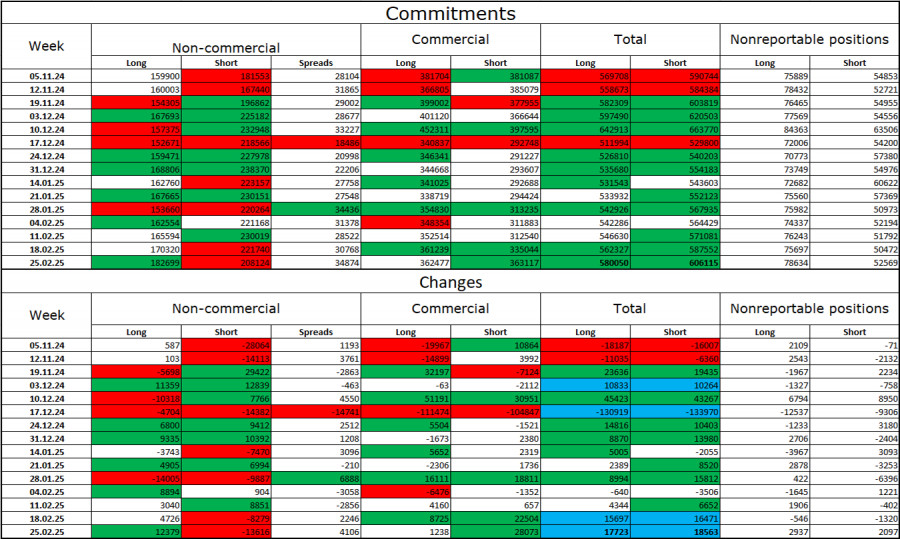
In the latest reporting week, professional traders opened 12,379 long positions and closed 13,616 short positions. While the non-commercial category remains bearish, sentiment has been softening in recent weeks. The total number of long positions held by speculators now stands at 182,000, while short positions amount to 208,000.

For the past twenty weeks, large players have been selling the euro, reinforcing a bearish trend. Occasionally, bulls dominate during individual weeks, but these instances are exceptions. The difference in monetary policy approaches between the ECB and the Fed continues to favor the U.S. dollar, as rate differentials widen. While the bearish advantage is diminishing, it is still too early to declare the end of the downtrend. Notably, long positions have been increasing for four consecutive weeks.

Key Events to Watch (March 7, 2025):

  • Eurozone – ECB President Christine Lagarde Speech (09:30 UTC)
  • Eurozone – Q4 GDP Growth Rate (10:00 UTC)
  • U.S. – Nonfarm Payrolls Report (13:30 UTC)
  • U.S. – Unemployment Rate (13:30 UTC)
  • U.S. – Average Hourly Earnings (13:30 UTC)
  • U.S. – Federal Reserve Chair Jerome Powell Speech (17:30 UTC)

The economic calendar for March 7 includes six major events, each of critical importance. Market sentiment on Friday is likely to be heavily influenced by the news cycle.

EUR/USD Forecast & Trading Recommendations

Sell EUR/USD upon a break below the 1.0781–1.0797 zone on the hourly chart, targeting 1.0734 and 1.0622. Alternatively, sell upon a rejection from the 1.0857 level. Buying EUR/USD is an option, but the strong, uninterrupted rally is concerning—it could reverse sharply at any moment.

Fibonacci retracement levels were calculated using 1.0529–1.0213 on the hourly chart and 1.1214–1.0179 on the 4-hour chart.

Samir Klishi,
ইন্সটাফরেক্সের বিশ্লেষণ বিশেষজ্ঞ
© 2007-2025
টাইমফ্রেম নির্বাচন করুন
5
মিনিট
15
মিনিট
30
মিনিট
1
ঘন্টা
4
ঘন্টা
1
দিন
1
সপ্তাহ
ইনস্টাফরেক্স দিয়ে ক্রিপ্টোমুদ্রা দর পরিবর্তনে আয় করুন।
মেটাট্রেডার 4 ডাউনলোড করে আপনার প্রথম ট্রেড চালু করুন।
  • Grand Choice
    Contest by
    InstaForex
    InstaForex always strives to help you
    fulfill your biggest dreams.
    প্রতিযোগীতায় অংশগ্রহণ করুন

সুপারিশকৃত নিবন্ধ

AUD/USD পূর্বাভাস: ৯ এপ্রিল, ২০২৫

সোমবার এবং মঙ্গলবার 0.6133 লক্ষ্যমাত্রার দিকে এগোতে অস্ট্রেলিয়ান ডলারের মূল্যের যে প্রচেষ্টা পরিলক্ষিত হয়েছিল, তা থেমে যায় (যার প্রমাণ লম্বা আপার শ্যাডোগুলো)—তবে এই পেয়ারের মূল্যের লক্ষ্যমাত্রা আজও একই রয়েছে। 0.5943

Laurie Bailey 07:04 2025-04-09 UTC+2

স্বর্ণের (XAU/USD)–এর ট্রেডিং সিগন্যাল, ২৫–২৭ মার্চ, ২০২৫: মূল্য $3,024 (21 SMA - 7/8 মারে) এর ওপরে থাকা অবস্থায় স্বর্ণ কিনুন

মার্কিন সেশনের শুরুতে, স্বর্ণ $3,021 এর আশেপাশে ট্রেড করছে, যে লেভেলটি 21-SMA এর নিচে এবং ১৯ মার্চ থেকে গঠিত হওয়া বিয়ারিশ ট্রেন্ড চ্যানেলের মধ্যে অবস্থিত। H4 চার্টে আমরা দেখতে পাচ্ছি

Dimitrios Zappas 14:33 2025-03-25 UTC+2

স্বর্ণের (XAU/USD) ট্রেডিং সিগন্যাল – মার্চ ১৯-২১, ২০২৫: মূল্য $3,045 (+2/8 মারে + 21 SMA) এর নিচে থাকা অবস্থায় স্বর্ণ বিক্রির সুযোগ রয়েছে

মার্কিন সেশনের শুরুতে, গোল্ড $3,039 লেভেলের কাছাকাছি ট্রেড করছে, মূল্য +2/8 মারে লেভেলের নিচে অবস্থান করছে এবং ওভারবট লেভেলে পৌঁছেছে। প্রযুক্তিগতভাবে, স্বর্ণের তীব্র দরপতনের সম্ভাবনা রয়েছে। ইউরোপীয় সেশনে, স্বর্ণের মূল্য

Dimitrios Zappas 14:36 2025-03-19 UTC+2

স্বর্ণের (XAU/USD) ট্রেডিং সিগন্যাল, ৬-৮ মার্চ, ২০২৫: মূল্য $2,920 (21 SMA - 6/8 মারে) এর নিচে থাকা অবস্থায় স্বর্ণ বিক্রি করুন (২১ SMA - ৬/৮ মারে)

মার্কিন সেশনের শুরুতে, স্বর্ণ $2,904-এ ট্রেড করা হচ্ছি, যা ইউরোপিয়ান সেশনে 6/8 মারে ($2,889) টেস্ট করার পর পুনরুদ্ধার করেছে। আগামী কয়েক ঘণ্টার মধ্যে স্বর্ণের মূল্যের ঊর্ধ্বমুখী প্রবণতা বজায় থাকতে পারে

Dimitrios Zappas 15:06 2025-03-06 UTC+2

স্বর্ণের (XAU/USD) ট্রেডিং সিগন্যাল – ৪-৬ মার্চ, ২০২৫: মূল্য $2,908 (21 SMA - 61.8%) লেভেলের নিচে থাকা অবস্থায় স্বর্ণ বিক্রি করুন

টেকনিক্যালি, স্বর্ণের মূল্য ওভারবট লেভেলে পৌঁছেছে। তবে, আমরা ধারণা করছি যে টেকনিক্যাল কারেকশন আরও কিছু সময়ের জন্য চলতে পারে, যেখানে মূল্য $2,890 (6/8 মারে) এবং 21 SMA লেভেলের কাছাকাছি $2,880-এ

Dimitrios Zappas 07:51 2025-03-05 UTC+2

S&P 500 সূচকের পূর্বাভাস, ২৭ ফেব্রুয়ারি, ২০২৫

S&P 500 সূচকটি দীর্ঘ সময় ধরে অবস্থান ধরে রাখার চেষ্টা করেছিল, তবে শেষ পর্যন্ত এটি সাপ্তাহিক চার্টে পরিলক্ষিত ডাবল ডাইভারজেন্সের চাপ সহ্য করতে পারেনি। মার্লিন অসিলেটর ইতোমধ্যেই নেগেটিভ টেরিটরিতে প্রবেশ

Laurie Bailey 06:32 2025-02-27 UTC+2

বিটকয়েনের পূর্বাভাস – ১২ ফেব্রুয়ারি, ২০২৫

দৈনিক চার্টে, বিটকয়েনের মূল্য ব্যালেন্স সূচক লাইনের (লাল রঙ দ্বারা চিহ্নিত মুভিং এভারেজ) উপরে উঠতে লড়াই করছে, যা নির্দেশ করে যে মার্কেটের ট্রেডাররা বিটকয়েন বিক্রির দিকে মনোযোগ দিচ্ছে। মার্লিন অসিলেটরের

Laurie Bailey 08:55 2025-02-12 UTC+2

তেলের পূর্বাভাস - ১০ ফেব্রুয়ারি ২০২৫

সাপ্তাহিক চার্টে, মূল্য সাময়িকভাবে MACD সূচকের লাইনটির নিচে নেমে গিয়েছিল, তবে দ্রুতই পুনরুদ্ধার ঘটেছে। নতুন সপ্তাহের শুরুতে মূল্য এই লাইনের উপরে থাকা অবস্থায় ট্রেডিং শুরু হয়েছে, এবং এখন মূল্য 71.44

Laurie Bailey 07:03 2025-02-10 UTC+2

গোল্ডের (XAU/USD) ট্রেডিং সিগন্যাল, ২৯-৩১ জানুয়ারি, ২০২৫: গোল্ডের মূল্য $2,765 (21 SMA - 7/8 মারে)-এর নিচে থাকা অবস্থায় এটি বিক্রি করুন

মার্কিন সেশনের শুরুতে, গোল্ড $2,758 এর আশেপাশে ট্রেড করছে, যা 7/8 মারে-এর নিচে এবং জানুয়ারির শুরু থেকে গঠিত আপট্রেন্ড চ্যানেলের মধ্যে রয়েছে। গোল্ডের দরপতনের লক্ষণ দেখা যাচ্ছে। তাই, পরবর্তী কয়েক

Dimitrios Zappas 14:25 2025-01-29 UTC+2

EUR/USD-এর পূর্বাভাস, ২৯ জানুয়ারি, ২০২৫

গতকালকের সেশনের শেষের দিকে, EUR/USD পেয়ারের মূল্য দৈনিক চার্টে ব্যালেন্স ইন্ডিকেটর লাইনের নিচে নেমে গেছে। এটি এই ইঙ্গিত দেয় যে 1.0520 লেভেলের দিকে মূল্য বৃদ্ধি হয়তো একটি ভুল ব্রেকআউট ছিল

Laurie Bailey 07:29 2025-01-29 UTC+2
এখন কথা বলতে পারবেন না?
আপনার প্রশ্ন জিজ্ঞাসা করুন চ্যাট.
Widget callback
 

Dear visitor,

Your IP address shows that you are currently located in the USA. If you are a resident of the United States, you are prohibited from using the services of InstaFintech Group including online trading, online transfers, deposit/withdrawal of funds, etc.

If you think you are seeing this message by mistake and your location is not the US, kindly proceed to the website. Otherwise, you must leave the website in order to comply with government restrictions.

Why does your IP address show your location as the USA?

  • - you are using a VPN provided by a hosting company based in the United States;
  • - your IP does not have proper WHOIS records;
  • - an error occurred in the WHOIS geolocation database.

Please confirm whether you are a US resident or not by clicking the relevant button below. If you choose the wrong option, being a US resident, you will not be able to open an account with InstaForex anyway.

We are sorry for any inconvenience caused by this message.