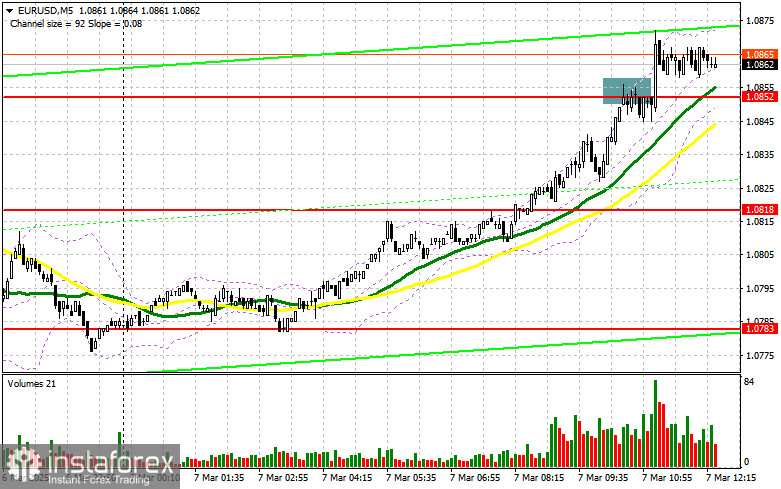
In my morning forecast, I focused on the 1.0852 level, planning to make trading decisions based on it. Looking at the 5-minute chart, we can see what happened. The rise and formation of a false breakout at this level provided an entry point for short positions, but the pair failed to decline, leading to losses. The technical picture for the second half of the day has been revised accordingly.
Opening Long Positions on EUR/USD:
Key U.S. labor market data, including the change in nonfarm payrolls and the unemployment rate, could disappoint, increasing pressure on the U.S. dollar. Additional data on average hourly earnings and private sector employment changes will also be released. The highlight of the day will be Fed Chair Jerome Powell's speech, which, if dovish, could trigger further growth in EUR/USD.
If the market reacts bearishly to the data, defending the nearest support at 1.0851 will be the primary task for buyers. I plan to go long after a false breakout at this level, aiming for a continuation of the uptrend towards resistance at 1.0885. A breakout and retest of this range will confirm a buying opportunity, with targets at 1.0914 and the key high at 1.0935, where I will lock in profits.
If EUR/USD declines and lacks buying interest around 1.0851—which could happen if Powell adopts a hawkish tone—the demand for the euro will weaken, and the pair may enter a new sideways channel. In this case, sellers could push the price down to 1.0818. I will only consider buying after a false breakout at this level. If no bounce occurs, I will wait for a test of 1.0783, where I plan to enter long positions on an intraday rebound of 30-35 points.
Opening Short Positions on EUR/USD:
Sellers attempted to gain control, but strong demand for risk assets prevented a significant move lower by the end of the week. Further developments will depend on the data. Strong U.S. labor market figures and a false breakout around 1.0885 would provide a short entry point, targeting a correction towards support at 1.0851. A break and consolidation below this range will create another selling opportunity, pushing the price toward 1.0818, with an extended target at 1.0783, where I will take profits. This level also aligns with the moving averages, which are currently favoring the bulls.
If EUR/USD moves higher in the second half of the day and bears fail to show strength near 1.0885, buyers may push the pair for another rally. In this scenario, I will delay short positions until a test of 1.0914, where I plan to sell only after an unsuccessful breakout attempt. If the pair reaches 1.0935, I will enter short positions on a rebound, aiming for a downward correction of 30-35 points.
COT Report Analysis (Commitment of Traders Report)
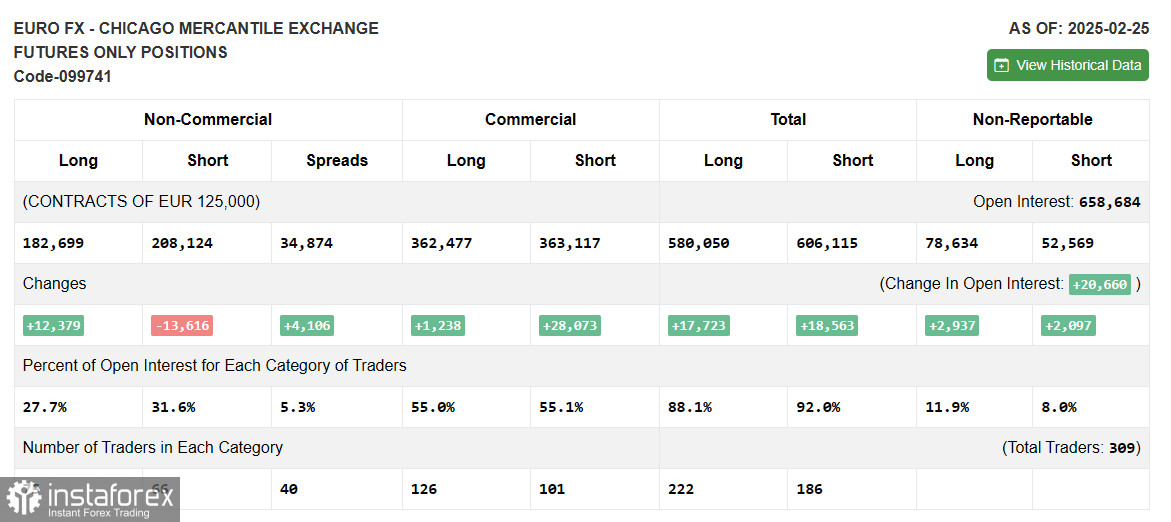
The COT report for February 25 showed an increase in long positions and a sharp reduction in short positions, indicating rising demand for the euro. U.S. pressure on Ukraine to negotiate a ceasefire continues to boost risk appetite, while Eurozone inflation data in line with ECB expectations supports further rate cuts, which could stimulate economic growth and make the euro more attractive for buying.
However, the overall advantage still remains with euro sellers, so caution is advised when buying at highs. The COT report showed that non-commercial long positions increased by 12,379 to 182,699, while short positions declined by 13,616 to 208,124, resulting in a net position increase of 4,106.
Indicator Signals
Moving Averages
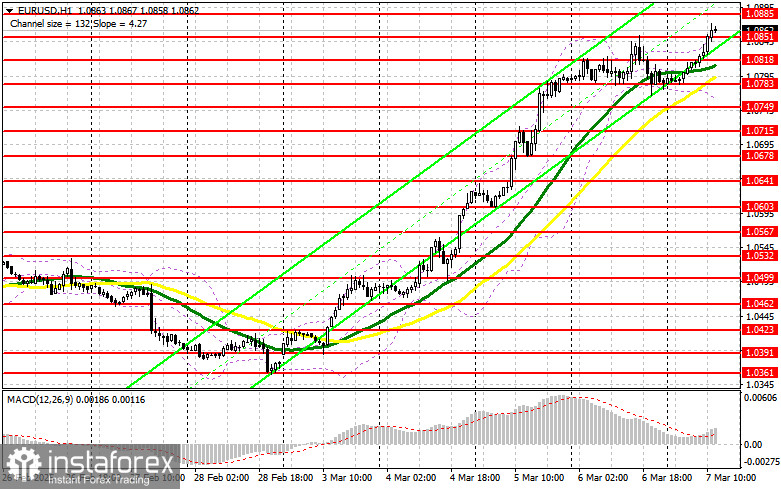
The pair is trading above the 30- and 50-day moving averages, signaling further upward potential for the euro.
Note: The moving average periods and prices analyzed in this forecast are based on the H1 timeframe, which differs from the D1 daily moving average settings.
Bollinger Bands
If the price declines, the lower boundary of the Bollinger Bands around 1.0780 will act as support.
Indicator Descriptions:
- Moving Average (MA) – A trend-following indicator that smooths out volatility and noise to identify the current trend.
- 50-period MA (yellow line on the chart).
- 30-period MA (green line on the chart).
- MACD (Moving Average Convergence/Divergence) – Measures momentum and potential trend reversals.
- Fast EMA: 12-period
- Slow EMA: 26-period
- SMA: 9-period
- Bollinger Bands – Measures volatility and potential price breakouts.
- Non-Commercial Traders – Speculators such as retail traders, hedge funds, and large institutions that use the futures market for speculative purposes.
- Non-Commercial Long Positions – The total open long positions held by non-commercial traders.
- Non-Commercial Short Positions – The total open short positions held by non-commercial traders.
- Net Non-Commercial Position – The difference between non-commercial short and long positions.