GBP/USD 5-Minute Analysis
Unlike the euro, the GBP/USD currency pair continued its upward movement on Wednesday. The British currency is not standing still; it is taking advantage of favorable conditions. Although the euro struggled to rise yesterday—possibly reaching its peak—the pound still has room to grow, and that is exactly what it is doing.
Yesterday, the only economic report released indicated further declines for the U.S. dollar. The U.S. Consumer Price Index (CPI) and Core CPI both slowed more than expected, increasing the likelihood that the Federal Reserve will ease monetary policy soon. Given the dollar was already falling before this report, its subsequent decline is not surprising. Moreover, news emerged that the UK is negotiating with the Trump administration to avoid a potential tariff war. While the success of these negotiations and the conditions for an agreement remain uncertain, it is less likely that the UK will face the same "Damocles sword" threat as the EU and other nations. This is undoubtedly a positive development for both the British economy and the pound. Meanwhile, the market seems to confidently ignore all other factors, seemingly placing little importance on them.
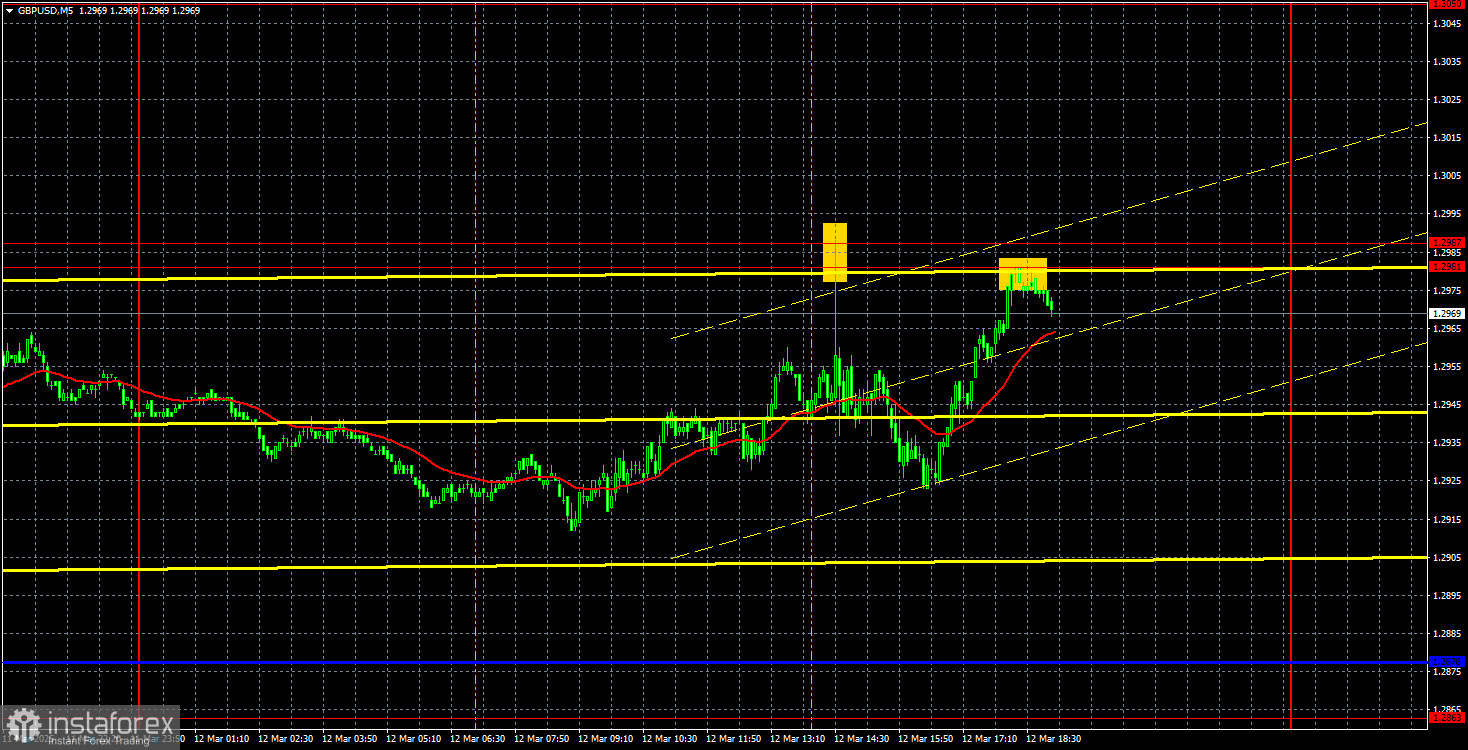
Yesterday, there were two buy signals for the euro and two sell signals for the pound. The price bounced twice from the 1.2981-1.2987 area. The first bounce occurred within five minutes of the U.S. inflation report, making it difficult to react to the signal, while the second bounce happened later in the evening and was quite weak. Given that the pound is in a steady uptrend, short positions should not be prioritized at this time.
COT Report
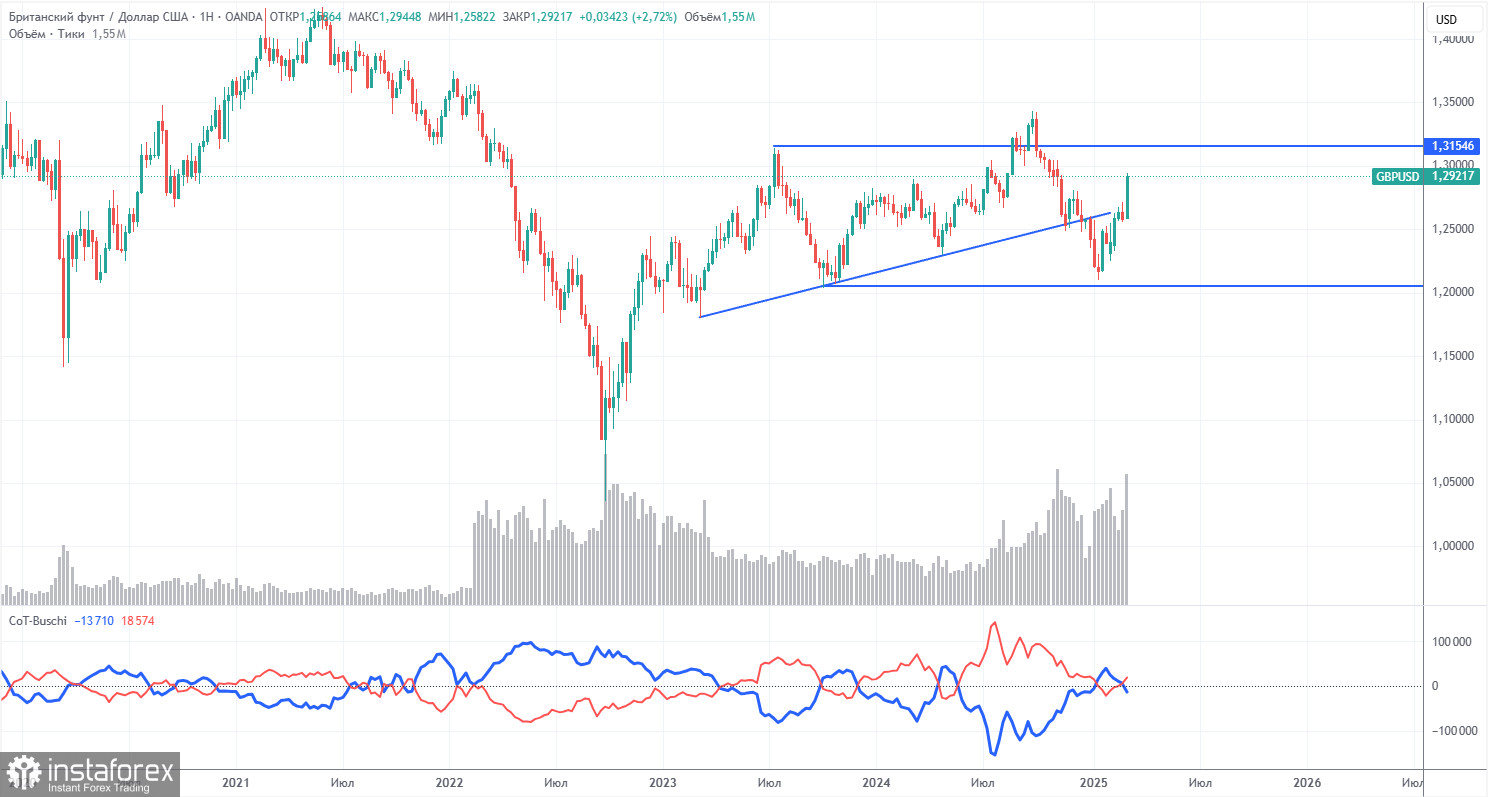
COT reports for the British pound indicate that the sentiment among commercial traders has been fluctuating in recent years. The red and blue lines, representing the net positions of commercial and non-commercial traders, frequently intersect and typically hover around the zero line. Currently, these lines are close to each other, indicating a roughly equal number of buy and sell positions.
On the weekly timeframe, the price initially broke the 1.3154 level before dropping to the trend line, which it subsequently broke through. This break suggests that the pound's decline is likely to continue. However, there was also a bounce from the second-to-last local low on the weekly chart, which could imply a flat market.
According to the latest COT report on the British pound, the "Non-commercial" group opened 7,800 buy contracts and closed 6,300 sell contracts. Consequently, the net position of non-commercial traders increased by 14,100 contracts over the week, which does not significantly favor the pound.
The fundamental backdrop still offers no solid reasons for long-term investments in the British pound, and the currency faces a real possibility of continuing its global downtrend. Although the pound has recently experienced a notable increase, the underlying cause appears to be related to Donald Trump's policies.
GBP/USD 1-Hour Analysis
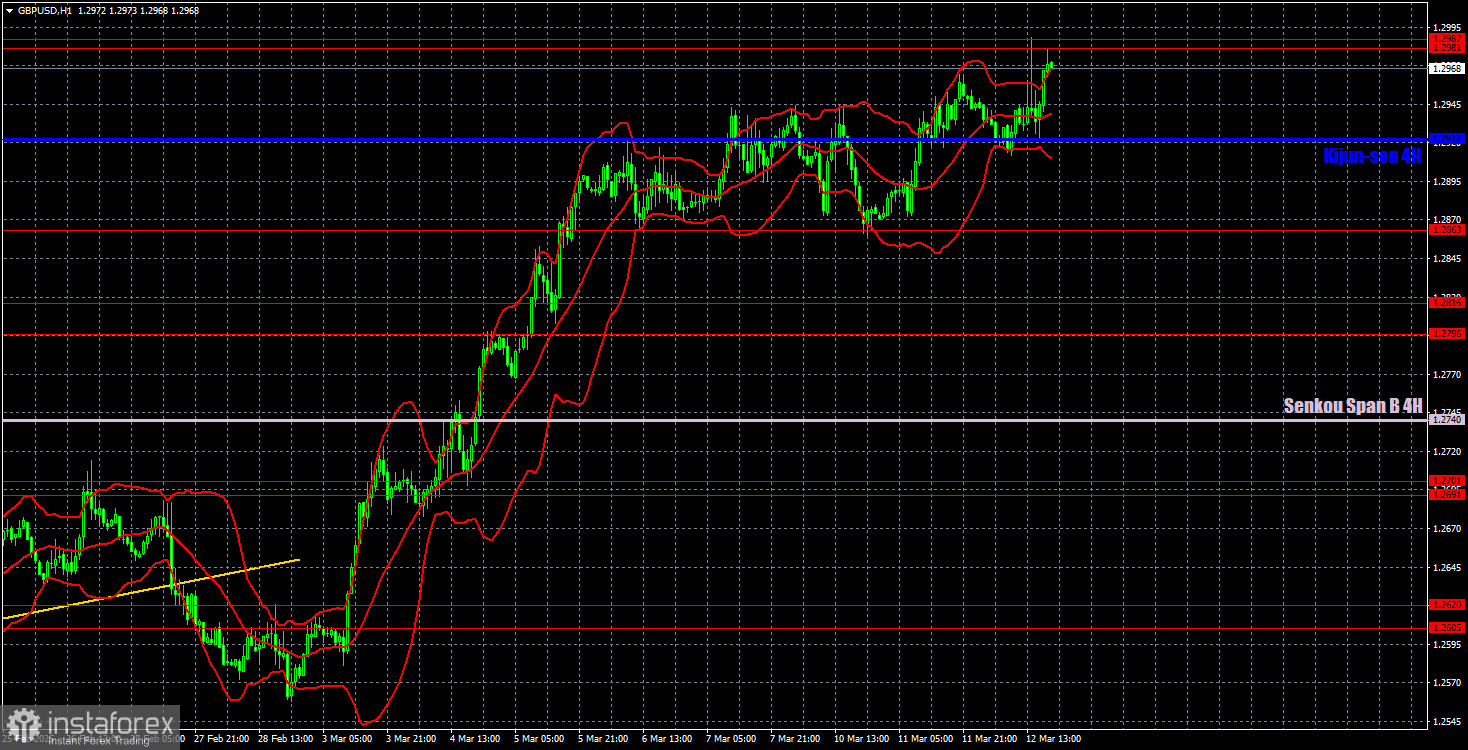
On the hourly timeframe, the GBP/USD pair continues its upward trend, which increasingly resembles a collapse of the U.S. dollar. This may not be the last trend shift within the ongoing bullish correction on the daily timeframe, but this correction is already overdue for completion. We still do not see any long-term fundamental reasons for the pound to continue rising. Currently, the only thing supporting the pound is Donald Trump, who keeps imposing tariffs and sanctions left and right—but not against the UK. The market is completely ignoring all other factors.
For March 13, the key levels for trading are 1.2237-1.2255, 1.2331-1.2349, 1.2429-1.2445, 1.2511, 1.2605-1.2620, 1.2691-1.2701, 1.2796-1.2816, 1.2863, 1.2981-1.2987, 1.3050. The Senkou Span B (1.2740) and Kijun-sen (1.2922) lines may also provide signals. Setting a Stop Loss at breakeven is recommended if the price moves 20 pips in the correct direction. The Ichimoku indicator lines may shift throughout the day, so this should be considered when identifying trading signals.
On Thursday, the UK will not have any significant events, while the U.S. will publish only two secondary reports. A pause in market activity is possible, but Donald Trump could introduce new disruptions at any moment.
Illustration Explanations:
- Support and Resistance Levels (thick red lines): Thick red lines indicate where movement may come to an end. Please note that these lines are not sources of trading signals.
- Kijun-sen and Senkou Span B Lines: Ichimoku indicator lines transferred from the 4-hour timeframe to the hourly timeframe. These are strong lines.
- Extreme Levels (thin red lines): Thin red lines where the price has previously bounced. These serve as sources of trading signals.
- Yellow Lines: Trendlines, trend channels, or any other technical patterns.
- Indicator 1 on COT Charts: Represents the net position size for each category of traders.