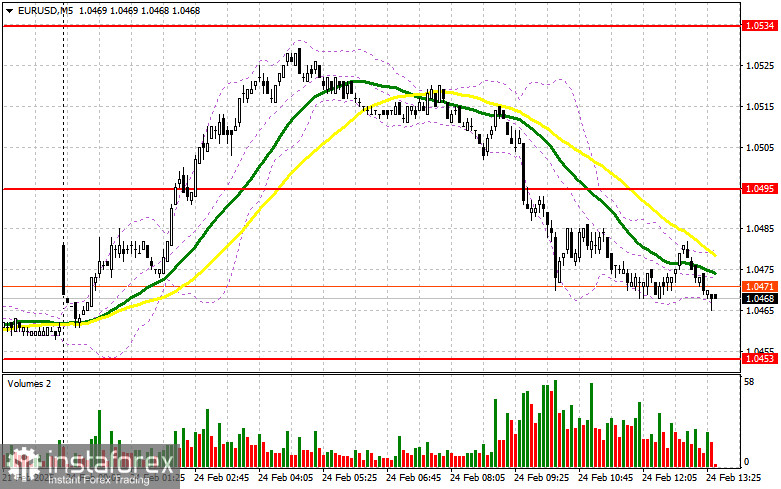
In my morning forecast, I focused on the 1.0495 level as a key decision point for market entry. Looking at the 5-minute chart, we can see that the price dropped to 1.0495, but no suitable entry points formed, leaving me without trades. The technical picture has been reassessed for the second half of the day.
For Opening Long Positions on EUR/USD:
Disappointing IFO data from Germany quickly renewed pressure on the euro, leading to a sharp decline. As a result, the morning gains following Friedrich Merz's election victory in Germany were completely erased. Unfortunately, there are no scheduled U.S. economic reports or Federal Reserve speeches in the second half of the day, which could lead to lower market volatility.
If euro selling pressure persists, I will focus on the nearest support at 1.0446. A false breakout at this level would create a good entry point for buying, targeting the resistance at 1.0491, which formed during the European session. A break and retest of this range would confirm a buying signal, pushing EUR/USD toward 1.0527. The furthest upward target is 1.0564, where I plan to take profit.
If EUR/USD falls further and there is no bullish reaction at 1.0446, euro buyers will lose control, allowing sellers to drive the pair down to 1.0404. Only a false breakout at this level would justify a long position. Otherwise, I will wait for a rebound from 1.0364 to initiate a 30-35 point intraday correction.
For Opening Short Positions on EUR/USD:
Lacking new positive news, sellers have regained control over the euro. If EUR/USD rises in the second half of the day, the focus will shift to defending the new resistance at 1.0491. If this level is breached, bulls will regain control.
To confirm their market presence, sellers need to achieve a false breakout at 1.0491, creating a short entry with a downward target at 1.0446—slightly above the moving averages, which currently favor buyers. A break and retest of this level from below would reinforce the bearish outlook, pushing EUR/USD toward 1.0404, halting any bullish momentum. The final downward target is 1.0364, where I will take profit.
If EUR/USD rises further and sellers show no activity at 1.0491, bulls could trigger another strong rally. In this case, I will delay short positions until a test of 1.0527. If price struggles to hold above this level, I will sell on a failed breakout. Otherwise, I will wait for a rebound from 1.0564 to execute a 30-35 point downward correction.
COT Report Analysis (Commitment of Traders):
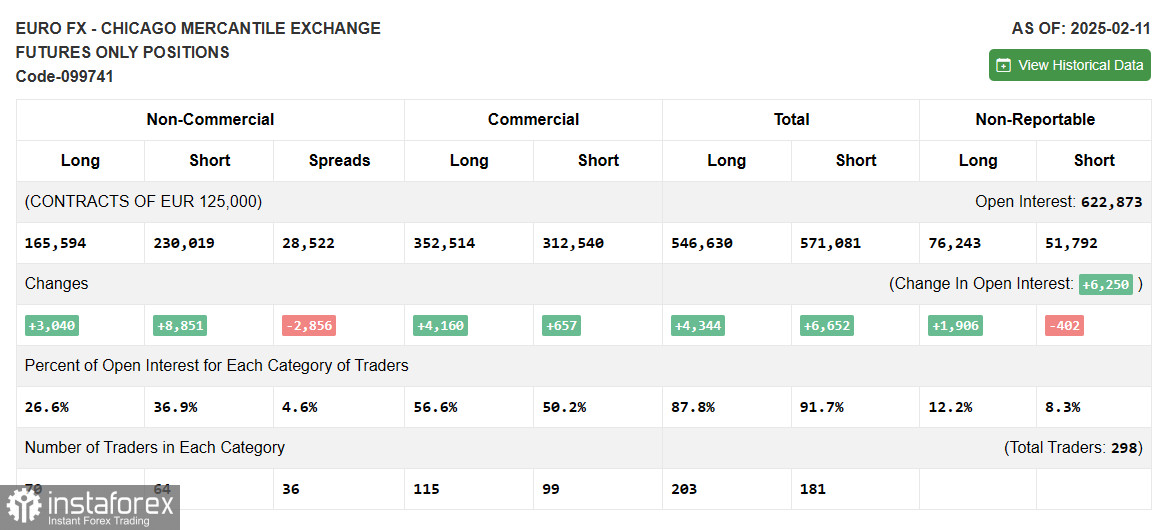
The February 11 COT report showed an increase in both long and short positions. More traders were willing to sell the euro than buy it, but it's worth noting that this report does not account for the phone conversation between Putin and Trump. Therefore, it may not fully reflect the market shift toward buyers, which will become clearer next week.
For now, the weakness of the U.S. dollar persists, especially given lackluster U.S. economic data in recent weeks. According to the COT report, long non-commercial positions increased by 3,040 contracts, reaching 165,594, while short non-commercial positions grew by 8,851 contracts, reaching 230,019. As a result, the gap between long and short positions narrowed by 2,856.
Indicator Signals
Moving Averages
Trading is occurring around the 30 and 50-period moving averages, indicating market uncertainty.
Note: The moving averages are assessed on the H1 chart, which may differ from classic definitions used for daily moving averages on the D1 chart.
Bollinger Bands
In case of a decline, the lower Bollinger Band at 1.0469 will act as support.
Indicator Explanations:
- Moving Averages (MA) – Identify current trends by smoothing volatility and market noise.
- 50-period MA (Yellow line on the chart).
- 30-period MA (Green line on the chart).
- MACD (Moving Average Convergence/Divergence) – Identifies trend strength and reversals.
- Fast EMA – 12-period
- Slow EMA – 26-period
- SMA – 9-period
- Bollinger Bands – Helps identify support, resistance, and volatility levels.
- 20-period Bollinger Bands used.
- Non-commercial traders – Speculators such as individual traders, hedge funds, and institutions, who trade futures for speculation.
- Long non-commercial positions – Total long positions held by speculators.
- Short non-commercial positions – Total short positions held by speculators.
- Net non-commercial position – The difference between long and short positions of non-commercial traders.