4-hour timeframe
Amplitude of the last 5 days (high-low): 80p - 105p - 68p - 104p - 108p.
Average volatility over the past 5 days: 93p (average).
The GBP/USD currency pair, unlike the EUR/USD pair, traded downward for most of the penultimate trading day of the week. Since there has not been a single macroeconomic publication in the UK today, and the decline in the pound/dollar quotes began at the European trading session, it can be assumed that US reports were not involved in the sale of the British currency on Thursday, February 27. However, nevertheless, with the release of US data, one can associate the continued fall of the pair or, for example, suggest that traders were ahead of the curve and played strong reports in advance, although the forecasts were just rather weak. We believe that, as in the case of the euro currency, the main reason for the current fall of the British currency is the technical one. Since the pound and the euro have different technical patterns, the movements today are different. The pound continues to be in the so-called "swing" and just dropped today to the lows of February 20, no more. There is no trend movement as such, although the downward trend still persists. We still believe that the pound has only one direction - down. Therefore, in principle, the drop in quotes should continue sooner or later.
Thursday's macroeconomic background was quite strong. All macroeconomic data should have come from overseas, and all of them turned out to be not weak in the end. Most attention was focused on data on orders for durable goods. The main indicator showed a decrease of 0.2% in January, but forecasts predicted a decrease of as much as 1.5%, so the real value was much better than the expectations of market participants. Moreover, the value of the previous month (2.4%) was revised in favor of an increase and amounted to +2.9%. The second most significant indicator, excluding defense and aviation orders, grew in January by 1.1% instead of + 0.1% predicted by experts. Excluding transport orders, the indicator grew by 0.9% against the forecast of +0.2%, and the previous value was also revised upward from -0.1% to +0.1%. And finally, the last derivative of the indicator of orders for durable goods excluding defense increased by 3.6% with a forecast of +1.3%. Thus, all four indicators out of four turned out to be stronger than forecasts, and two were also reviewed in the direction of improvement. The preliminary value of US GDP for the fourth quarter was also published today, which was very expected to be +2.1%, as a quarter earlier. Thus, this report turned out to be neutral. As we have already said, the euro did not react to these publications, and the pound sterling simply continued the earlier begun decline, which is likely to continue today.
The fundamental background for the British pound was also quite weak today. It became known already in the morning that the government of Boris Johnson was seriously thinking about withdrawing from any negotiations with Brussels on a trade deal by June if progress was not seen. Johnson's Cabinet of Ministers understands progress as the acceptance by the European Union of her, Britain, interests and conditions. If the EU does not meet London, the prime minister is ready to curtail any further negotiations and leave the EU on December 31 without any deal. We have said more than once that the lack of a deal with the EU is a new blow to the British economy. However, Boris Johnson, it seems, is ready to take any risks, if only to finally complete the "divorce" with the EU and completely leave the jurisdiction of Brussels. As we expected earlier, the pound will fall for all of 2020.
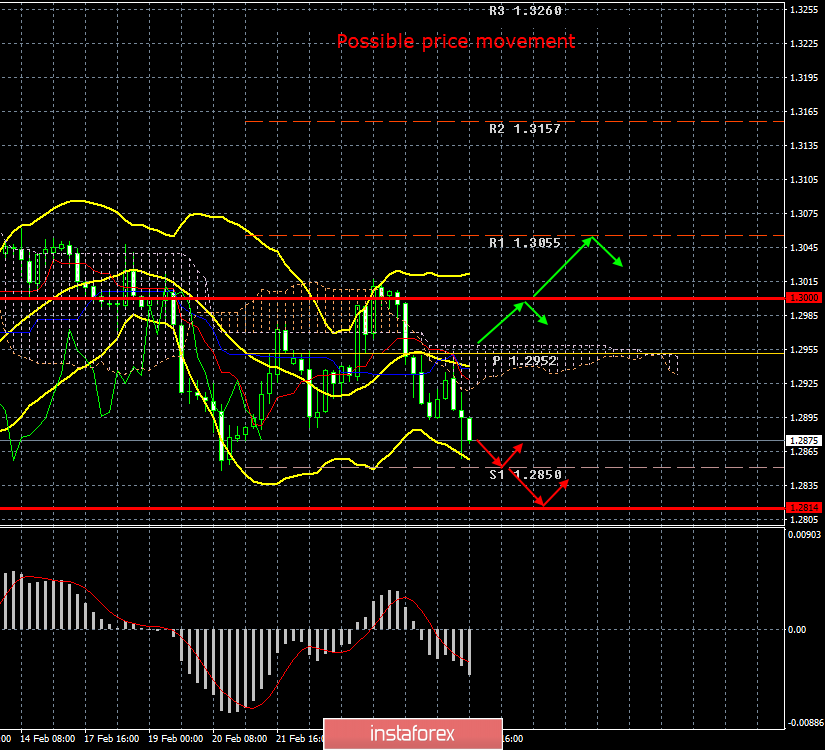
From a technical point of view, the "swing" continues. Thus, today or tomorrow we can witness a new round of upward movement. The pound is now facing the first support level of 1.2850, which the price could not overcome last time. Thus, the pound/dollar pair is now not the most attractive tool for trading. And of course, there's a fundamental background ... We still don't see how it can improve if the UK economy continues to slow down, it can slow down even more during 2020 and 2021, and the prospects for a trade deal between the EU and Britain remain vague. Therefore, now the British currency is still balancing on the verge of not collapsing, but it seems that this will happen sooner or later.
Trading recommendations:
GBP/USD is trying to resume a downward trend. Thus, it is now possible to sell the British pound with the target of 1.2850. However, the pair may not leave below this level. In any case, a rebound from the first target or a reversal of the MACD indicator upwards will signal a round of correction. We recommend considering the pair's purchases with a target of 1.3000 small lots if the bulls re-consolidate the pair above the Kijun-sen line.
Explanation of the illustration:
Ichimoku indicator:
Tenkan-sen is the red line.
Kijun-sen is the blue line.
Senkou Span A - light brown dotted line.
Senkou Span B - light purple dashed line.
Chikou Span - green line.
Bollinger Bands Indicator:
3 yellow lines.
MACD indicator:
Red line and bar graph with white bars in the indicators window.
Support / Resistance Classic Levels:
Red and gray dashed lines with price symbols.
Pivot Level:
Yellow solid line.
Volatility Support / Resistance Levels:
Gray dotted lines without price designations.
Possible price movements:
Red and green arrows.