signal strength 1 of 5
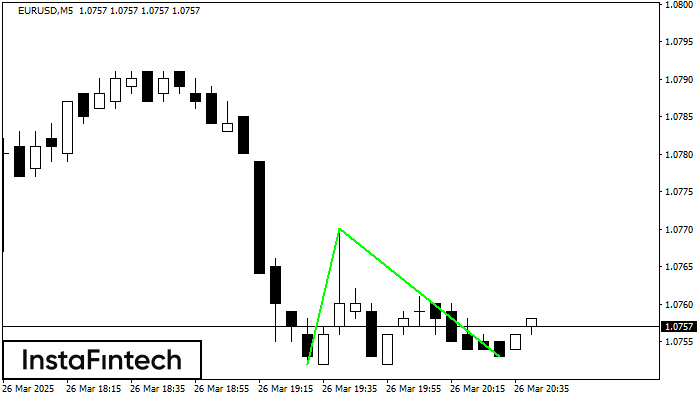
The Double Bottom pattern has been formed on EURUSD M5; the upper boundary is 1.0770; the lower boundary is 1.0753. The width of the pattern is 18 points. In case of a break of the upper boundary 1.0770, a change in the trend can be predicted where the width of the pattern will coincide with the distance to a possible take profit level.
The M5 and M15 time frames may have more false entry points.
See Also
- All
- Double Top
- Flag
- Head and Shoulders
- Pennant
- Rectangle
- Triangle
- Triple top
- All
- #AAPL
- #AMZN
- #Bitcoin
- #EBAY
- #FB
- #GOOG
- #INTC
- #KO
- #MA
- #MCD
- #MSFT
- #NTDOY
- #PEP
- #TSLA
- #TWTR
- AUDCAD
- AUDCHF
- AUDJPY
- AUDUSD
- EURCAD
- EURCHF
- EURGBP
- EURJPY
- EURNZD
- EURRUB
- EURUSD
- GBPAUD
- GBPCHF
- GBPJPY
- GBPUSD
- GOLD
- NZDCAD
- NZDCHF
- NZDJPY
- NZDUSD
- SILVER
- USDCAD
- USDCHF
- USDJPY
- USDRUB
- All
- M5
- M15
- M30
- H1
- D1
- All
- Buy
- Sale
- All
- 1
- 2
- 3
- 4
- 5

El patrón de reversión Doble Techo ha sido formado en #KO M5. Características: el límite superior 69.94; el límite inferior 69.49; el ancho del patrón es 50 puntos. Es mejor
Los marcos de tiempo M5 y M15 pueden tener más puntos de entrada falsos.
Open chart in a new window
El patrón Bandera bajista ha sido formado en el gráfico GOLD M5. Por consiguiente, es probable que la tendencia bajista continúe a corto plazo. Tan pronto el precio rompa
Los marcos de tiempo M5 y M15 pueden tener más puntos de entrada falsos.
Open chart in a new window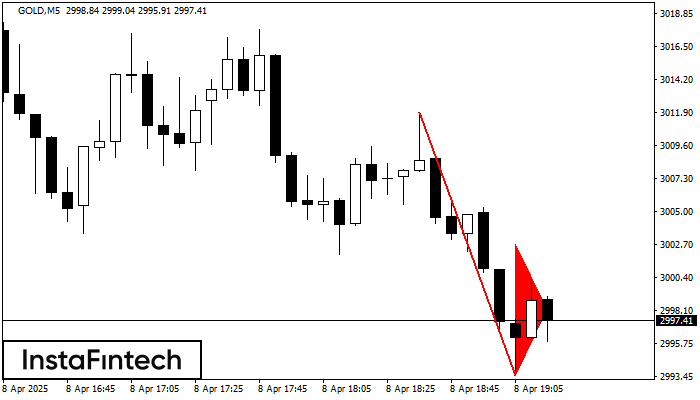
El patrón Banderín bajista se ha formado en el gráfico GOLD M5. Este tipo de patrón se caracteriza por una ligera disminución después de lo cual el precio se moverá
Los marcos de tiempo M5 y M15 pueden tener más puntos de entrada falsos.
Open chart in a new window