signal strength 1 of 5
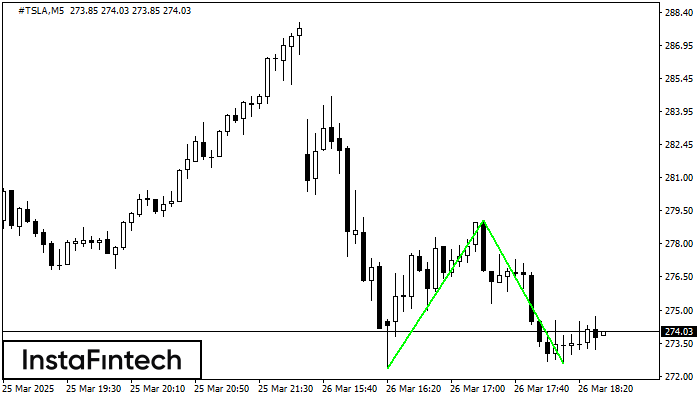
The Double Bottom pattern has been formed on #TSLA M5. Characteristics: the support level 272.37; the resistance level 279.03; the width of the pattern 666 points. If the resistance level is broken, a change in the trend can be predicted with the first target point lying at the distance of 645 points.
The M5 and M15 time frames may have more false entry points.
Vea asimismo
- All
- Double Top
- Flag
- Head and Shoulders
- Pennant
- Rectangle
- Triangle
- Triple top
- All
- #AAPL
- #AMZN
- #Bitcoin
- #EBAY
- #FB
- #GOOG
- #INTC
- #KO
- #MA
- #MCD
- #MSFT
- #NTDOY
- #PEP
- #TSLA
- #TWTR
- AUDCAD
- AUDCHF
- AUDJPY
- AUDUSD
- EURCAD
- EURCHF
- EURGBP
- EURJPY
- EURNZD
- EURRUB
- EURUSD
- GBPAUD
- GBPCHF
- GBPJPY
- GBPUSD
- GOLD
- NZDCAD
- NZDCHF
- NZDJPY
- NZDUSD
- SILVER
- USDCAD
- USDCHF
- USDJPY
- USDRUB
- All
- M5
- M15
- M30
- H1
- D1
- All
- Buy
- Sale
- All
- 1
- 2
- 3
- 4
- 5
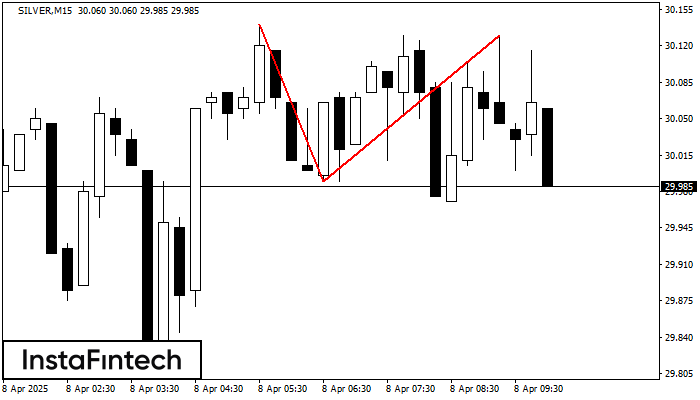
El patrón de reversión Doble Techo ha sido formado en SILVER M15. Características: el límite superior 30.14; el límite inferior 29.99; el ancho del patrón es 140 puntos. Es mejor
Los marcos de tiempo M5 y M15 pueden tener más puntos de entrada falsos.
Open chart in a new window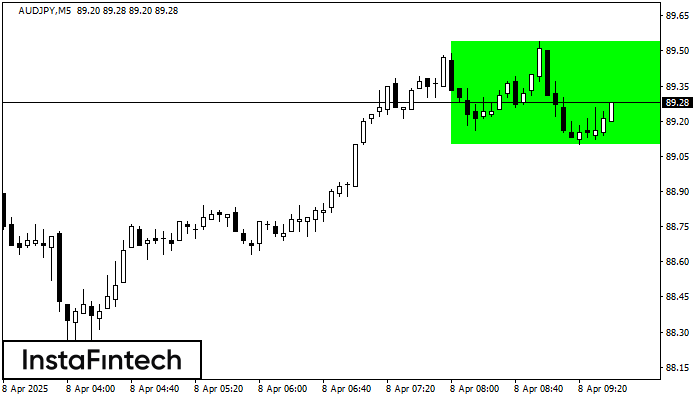
Según el gráfico de M5, AUDJPY formó el Rectángulo Alcista. Este tipo de patrón indica la continuación de una tendencia. Esto consiste de dos niveles: resistencia 89.54 y soporte 89.10
Los marcos de tiempo M5 y M15 pueden tener más puntos de entrada falsos.
Open chart in a new window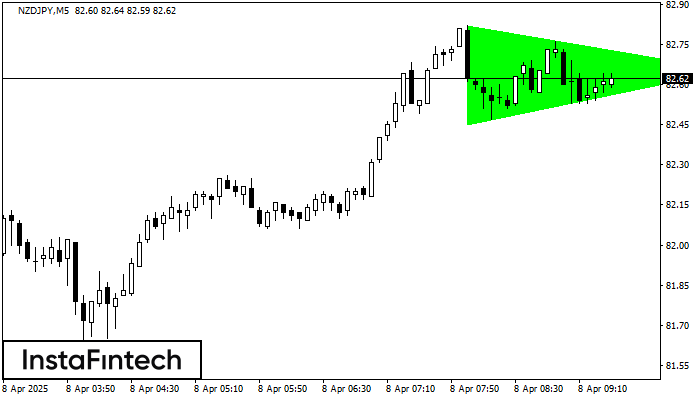
Según el gráfico de M5, NZDJPY formó el patrón Triángulo Simétrico Alcista. Descripción: Este es el patrón de la continuación de una tendencia. 82.82 y 82.45 son las coordenadas
Los marcos de tiempo M5 y M15 pueden tener más puntos de entrada falsos.
Open chart in a new window