signal strength 1 of 5
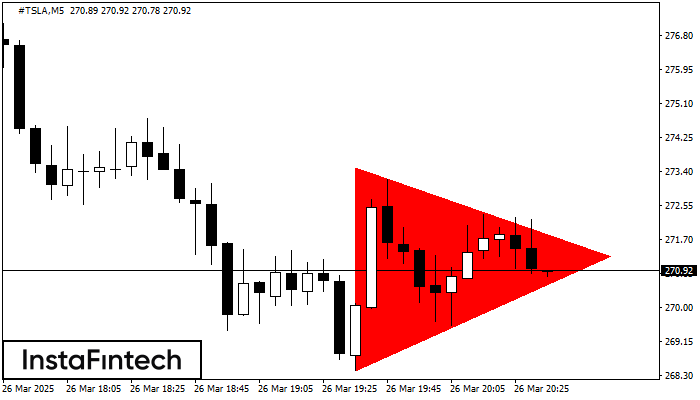
According to the chart of M5, #TSLA formed the Bearish Symmetrical Triangle pattern. This pattern signals a further downward trend in case the lower border 268.42 is breached. Here, a hypothetical profit will equal the width of the available pattern that is -509 pips.
The M5 and M15 time frames may have more false entry points.
Vea asimismo
- All
- Double Top
- Flag
- Head and Shoulders
- Pennant
- Rectangle
- Triangle
- Triple top
- All
- #AAPL
- #AMZN
- #Bitcoin
- #EBAY
- #FB
- #GOOG
- #INTC
- #KO
- #MA
- #MCD
- #MSFT
- #NTDOY
- #PEP
- #TSLA
- #TWTR
- AUDCAD
- AUDCHF
- AUDJPY
- AUDUSD
- EURCAD
- EURCHF
- EURGBP
- EURJPY
- EURNZD
- EURRUB
- EURUSD
- GBPAUD
- GBPCHF
- GBPJPY
- GBPUSD
- GOLD
- NZDCAD
- NZDCHF
- NZDJPY
- NZDUSD
- SILVER
- USDCAD
- USDCHF
- USDJPY
- USDRUB
- All
- M5
- M15
- M30
- H1
- D1
- All
- Buy
- Sale
- All
- 1
- 2
- 3
- 4
- 5
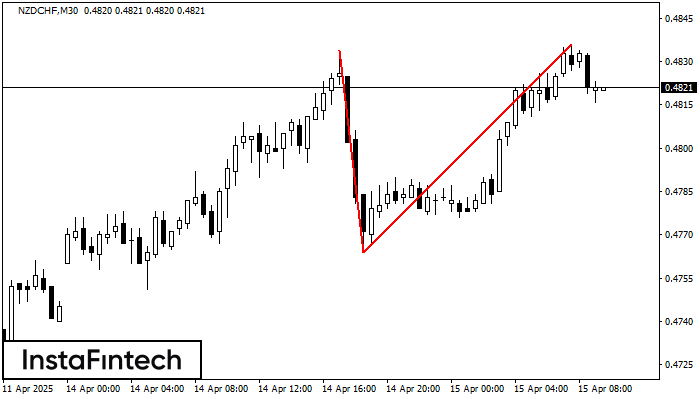
En el gráfico de NZDCHF M30 el patrón de reversión Doble Techo ha sido formado. Características: límite superior 0.4836; límite inferior 0.4764; el ancho del patrón 72 puntos. La señal
Open chart in a new window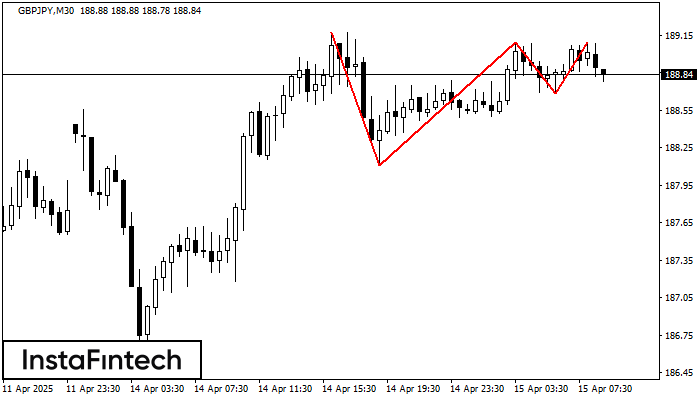
En el gráfico del instrumento de negociación GBPJPY M30, se ha formado el patrón Triple Techo que señala un cambio en la tendencia. Es posible que después de la formación
Open chart in a new window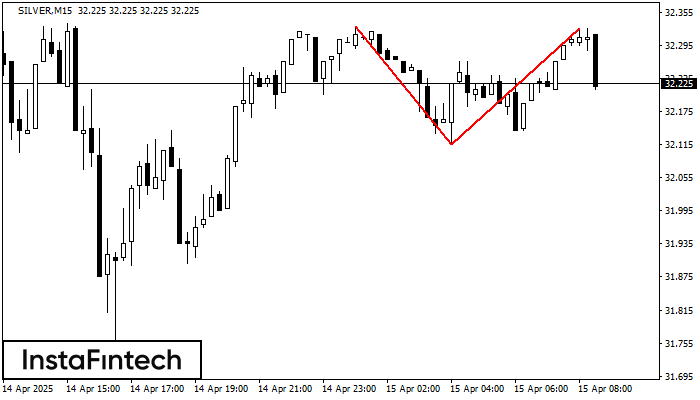
El patrón Doble Techo ha sido formado en SILVER M15. Esto señala que la tendencia ha sido cambiada de alcista a bajista. Probablemente, si la base del patrón 32.12
Los marcos de tiempo M5 y M15 pueden tener más puntos de entrada falsos.
Open chart in a new window