empty
28.02.2020 12:50 AM
EUR/USD. Results of February 27. Euro takes advantage of technical factors, Donald Trump boasts of a coronavirus vaccine

4-hour timeframe

This image is no longer relevant

Amplitude of the last 5 days (high-low): 43p - 80p - 67p - 60p - 54p.

Average volatility over the past 5 days: 61p (average).

The EUR/USD currency pair continued its upward movement on the fourth trading day of the week, which is still interpreted as a correction against a three-week fall in the euro. As already mentioned, the upward movement unexpectedly intensified today. It happened in the morning when no important macroeconomic statistics were published either in the European Union or in the United States, there were no important and high-profile speeches. Moreover, for example, the pound has been in a downward movement for most of the day, thus showing no correlation with the euro. From this we can already conclude that the reason for the strong growth of the euro was news and news not from the United States. Thus, Donald Trump's talk about coronavirus (to be discussed below) is definitely not to blame. Perhaps a strong rise in the European currency could be related to the speech of Christine Lagarde? However, as of the current moment, there is not a single news in the media related to the speech of the head of the ECB. Perhaps macroeconomic statistics from the eurozone had such a strong impact on the euro? In total, five indexes and indicators were published at the European trading session, reflecting the mood in the economy, consumer confidence and so on. None of these indices turned out to be lower than forecasted values, 3 out of 5 were better than forecasts, and 2 of the last 3 remained in the negative zone. Thus, we believe that they could not have three absolutely minor indexes, 2 of which remained in the negative zone to provoke the strengthening of the European currency by 100 points. Despite the fact that the normal volatility for the euro/dollar is 40-50 points per day. Moreover, a closer examination of the illustration makes it clear that the euro began to grow even at night, so daytime events and publications are certainly not reasons for strong purchases by euro traders. And one more fact, just to immediately close the topic of the impact of macroeconomic statistics on today's euro growth. Just half an hour ago, data on orders for durable goods in the United States were published, and all four indicators exceeded the forecast values, and the preliminary GDP value coincided with the forecast. Thus, statistics from overseas would simply have to cause the strengthening of the US currency, or at least stop the euro's growth, but this did not happen. Thus, we believe that the only reason for the upward movement of the euro/dollar pair is technical on Thursday, February 27. All the same technical need for correction after a long fall.

Now we'll take a closer look at all the published statistics and try to determine how it can affect the balance of power between currencies in the future. European statistics, as already mentioned, turned out to be very good, but initially it was secondary. The economic sentiment index in February amounted to 103.5 against the forecast of 102.8, the mood indicator in the services sector was 11.2 against the forecast of 11.0, the level of consumer confidence in February remained unchanged at -6.6, the business climate indicator exceeded forecasts of -0.28 and amounted to -0.04, and the index of business optimism in industry added 1.2 and amounted to -6.1. Thus, the figures even more eloquently indicate that European data could not cause such a strong growth of the euro. Since we figured out that non-economic data caused the euro to strengthen, we will look at all US statistics in the article on GBP/USD. Unlike the euro, the pound at least showed a hint of a reaction to the published data.

Meanwhile, U.S. President Donald Trump said that the United States is in full swing developing a vaccine against coronavirus. It is difficult to say how to interpret the words of the American leader, if literally at the same time, the director of the US National Institute of Allergy and Infectious Diseases Anthony Fauci said that the vaccine would be ready for use no earlier than a year later. Nevertheless, Donald Trump, who previously promised a quick death of the virus due to natural warming due to the arrival of spring, believes that the risk of contracting an American is minimal. Earlier, the US presidential administration requested Congress $2.5 billion to accelerate the process of creating a vaccine.

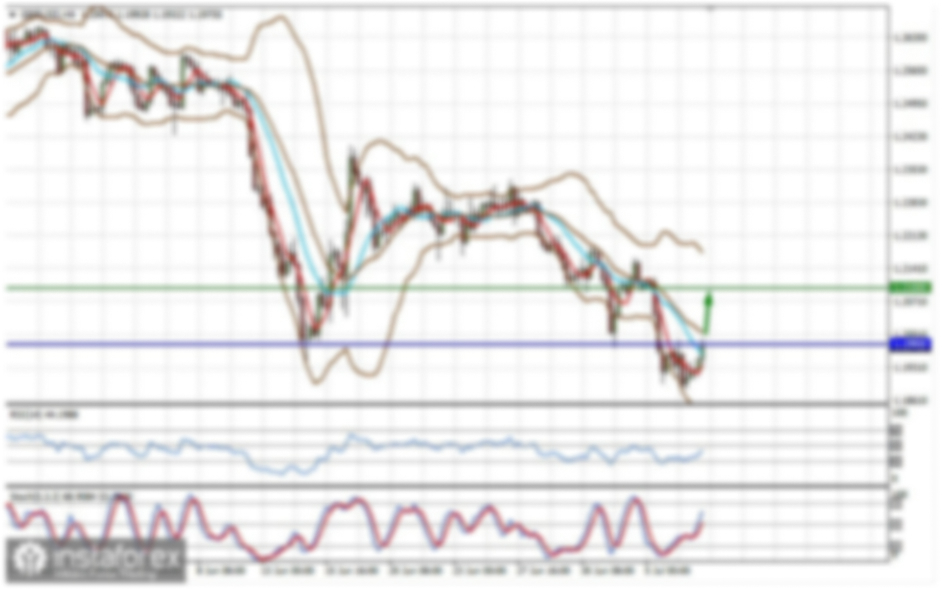
From a technical point of view, all three resistance levels and the upper limit of the volatility channel are overcome thanks to today's movement. Thus, traders now can only wait for the MACD indicator to turn down and begin a downward correction. The signal to buy the Golden Cross is strong.

Trading recommendations:

EUR/USD continues to move up. Thus, it is now possible to consider long positions, but all the goals have been worked out and overcome. Thus, you should turn to the higher timeframe for new goals. A downward correction may begin in the near future. It will be possible to return to selling the euro/dollar pair with the target of 1.0826, when traders will be able to gain a foothold back below the critical line.

Explanation of the illustration:

Ichimoku indicator:

Tenkan-sen is the red line.

Kijun-sen is the blue line.

Senkou Span A - light brown dotted line.

Senkou Span B - light purple dashed line.

Chikou Span - green line.

Bollinger Bands Indicator:

3 yellow lines.

MACD indicator:

Red line and bar graph with white bars in the indicators window.

Support / Resistance Classic Levels:

Red and gray dashed lines with price symbols.

Pivot Level:

Yellow solid line.

Volatility Support / Resistance Levels:

Gray dotted lines without price designations.

Possible price movements:

Red and green arrows.

Paolo Greco,
ผู้เชี่ยวชาญด้านการวิเคราะห์ของ InstaForex
© 2007-2025
เลือกช่วงเวลา
5
นาที
15
นาที
30
นาที
1
ชั่วโมง
4
ชั่วโมง
1
วัน
1
สัปดาห์
รับผลกำไรจากการเปลี่ยนแปลงอัตราสกุลเงินดิจิทัลกับ InstaForex.
ดาวน์โหลด MetaTrader 4 และเปิดการซื้อขายครั้งแรกของคุณ.
USD/JPY: เคล็ดลับการเทรดง่าย ๆ สำหรับนักเทรดมือใหม่ - 17 มีนาคม (ช่วงการซื้อขายในสหรัฐอเมริกา) การทดสอบที่ระดับ 148.68 เกิดขึ้นเมื่อดัชนี MACD เคลื่อนตัวลงต่ำอย่างมากจากจุดศูนย์ ซึ่งจำกัดศักยภาพในการลดลงของคู่เงินนี้ ด้วยเหตุนี้ ฉันจึงไม่ขายดอลลาร์และไม่เข้าตลาด ต่อมาวันนี้ จะมีการมุ่งเน้นไปที่ข้อมูลการขายปลีกของสหรัฐฯ ซึ่งเป็นตัวบ่งชี้ที่สำคัญต่อสุขภาพของเศรษฐกิจสหรัฐฯ นักลงทุนและนักวิเคราะห์จะติดตามตัวเลขเหล่านี้อย่างใกล้ชิด เพราะกิจกรรมของผู้บริโภคคือแรงขับเคลื่อนหลักของการเติบโตทางเศรษฐกิจ หากการขายปลีกเพิ่มขึ้น อาจสนับสนุนดอลลาร์สหรัฐฯ
  • Grand Choice
    Contest by
    InstaForex
    InstaForex always strives to help you
    fulfill your biggest dreams.
    เข้าร่วมการแข่งขัน


บทความแนะนำ

วิเคราะห์ตัวบอกสถานการณ์เมษายน 30, 2023 ของตัวบอกเมฆอิจิโคโมคานะสำหรับทองคำ

ราคาทองคำกำลังซื้อขายอยู่ในระดับ 2,034 ดอลลาร์ แนวโน้มระยะสั้นตามตัวชี้วัดคลาวด์ Ichimoku ในกราฟวันแสดงอยู่ในทิศทางขาขึ้น ราคาอยู่บน Kumo (คลาวด์) อย่างชัดเจนและยังไม่มีสัญญาณศักดิ์สิทธิ์ในการเปลี่ยนแนว ราคายังอยู่เหนือเส้นคิเจงเซ็น (ตัวบ่งชี้สีเหลือง) และเส้นเท็นกังเซ็น (ตัวบ่งชี้สีแดง) ตัวบ่งชี้เหล่านี้จะช่วยสนับสนุนที่ราคา

Alexandros Yfantis 21:52 2023-11-30 UTC+2

การวิเคราะห์ตัวบ่งชี้เมฆ Ichimoku บน EURUSD สำหรับวันที่ 29 พฤศจิกายน พ.ศ. 2566

EURUSD กำลังซื้อขายในระดับประมาณ 1.0980 ในทางเทคนิคของเมฆอิจิโมกุ แนวโน้มยังคงเป็นเช่นเดิม EURUSD มีระดับสูงสุดที่ 1.1017และเริ่มลดลงเพื่อทดสอบระดับสนับสนุนของเส้น tenkan-sen (ตัวบ่งชี้สีแดง)ที่ 1.0976 เส้น kijun-sen (ตัวบ่งชี้สีเหลือง)มีความสามารถในการสนับสนุนที่ 1.0952

Alexandros Yfantis 13:33 2023-11-29 UTC+2

การวิเคราะห์ตัวบ่งชี้เมฆอิชิโมกุเกี่ยวกับ EURUSD ในวันที่ 28 พฤศจิกายน พ.ศ. 2566

EURUSD กำลังซื้อขายรอบ 1.0950 ในทางเทคนิครูปแบบเมฆ Ichimoku ในกราฟ 4 ชั่วโมง แนวโน้มยังคงเป็นแบบข้างขึ้น เนื่องจากราคายังคงอยู่เหนือเมฆ (cloud) ได้ตลอดเวลา จุด Chikou (เส้นดำแสดงตัวบ่งชี้)

Alexandros Yfantis 14:41 2023-11-28 UTC+2

การวิเคราะห์ตัวชี้วัดเมฆอิชิโมกุในหุ้น USDJPY สำหรับวันที่ 28 พฤศจิกายน 2566

USDJPY กำลังซื้อขายรอบ 148.43 ในเชิงกลุ่มตะกอนอิจิโมกุ แสดงให้เห็นถึงความผันผวนกลางอยู่ในตอนนี้เนื่องจากราคาเข้าสู่คำโมกุประจำวัน (คลาวด์) ซึ่งแสดงถึงอาการอ่อนแอ ราคาไม่สามารถขึ้นเหนือเส้นเท็งคัน (สถานีสีแดง) และเส้นเคียวนคัน (สิ่งบ่งชี้สีเหลือง) แต่ในทางกลับกันราคาปิดต่ำกว่าขอบเขตคลาวด์บนเมื่อวานนี้ ส่วนตรงสาย Chikou (สถานีสีดำ)

Alexandros Yfantis 14:37 2023-11-28 UTC+2

การวิเคราะห์ดัชนีเมฆอิชิโมกุบนทองคำ สำหรับวันที่ 27 พฤศจิกายน พ.ศ. 2566

ราคาทองคำกำลังซื้อขายข้างบน $2,010 และกำลังสร้างสูงขึ้นเมื่อเทียบกับสูงในเดือนตุลาคม ในมุมมองของเมฆอิชิโมกุ แนวโน้มยังคงเป็นแบบบูรณาการ ราคาทองคำอยู่เหนือ Kumo (เมฆ) แท่งแดงอินดิเคเตอร์ระดับ Tenkan-sen และแท่งเหลืองอินดิเคเตอร์ระดับ Kijun-sen ทั้งสองอยู่ต่ำกว่าราคาปัจจุบันเป็น Chikou span

Alexandros Yfantis 14:57 2023-11-27 UTC+2

การวิเคราะห์ตัวช่วยอินดิเคเตอร์ Ichimoku cloud บน EURUSD สำหรับวันที่ 27 พฤศจิกายน ค.ศ. 2023

EURUSD กำลังซื้อขายอยู่ในระดับประมาณ 1.0950 ในแผนภูมิ 4 ชั่วโมงราคาก็ยังซื้ออยู่ด้านบนไอคิมอกุ คลาวด์ (มีแนวโน้มขาขึ้น) ขณะที่เชิงกายาณศิลป์ (เส้นดำ) ยังอยู่ด้านบนรูปแบบกระเสียบหรือก้านเทียนเทียน (มีแนวโน้มขาขึ้น) ในขณะเดียวกัน เท้าเข็มสีแดง (เส้นแดง)

Alexandros Yfantis 14:53 2023-11-27 UTC+2

การวิเคราะห์ตัวบ่งชี้เมฆอิชิโมกุด้าน USDJPY ในวันที่ 27 พฤศจิกายน พ.ศ. 2566

USDJPY กำลังซื้อขายอยู่ที่ราคาประมาณ 148.80 เจนนี้ ราคาในวันนี้อยู่ใกล้ๆ จุดเข้าสู่คลาวด์รายวัน (Daily Kumo) ซึ่งอาจทำให้เกิดการเปลี่ยนแนวโน้มจากตลาดแบบตัวขีดเขียนให้กลายเป็นภาวะเป็นระดับกลาง ราคาถูกเตียงรองคลาวด์และทดสอบเส้นเท็งคานเซ็น (เส้นสีแดง) และเส้นคิจุนเซ็น (เส้นสีเหลือง) USDJPY ถูกปฏิเสธที่เส้นต้านและขณะนี้กำลังเคลื่อนลงอีกครั้ง

Alexandros Yfantis 14:49 2023-11-27 UTC+2

การวิเคราะห์ตัวบ่งชี้เมฆอิชิโมกุใน Gold สำหรับวันที่ 24 พฤศจิกายน พ.ศ. 2566

ราคาทองคำกำลังซื้อขายอีกครั้งรอบรอบ 2,000 ดอลลาร์ แนวโน้มราคาในระยะสั้นยังคงเป็นแนวโน้มขาขึ้นเนื่องจากราคายังคงอยู่เหนือระดับสนับสนุนของ Kumo (เมฆ) สนธิต Chikou (ตัวชี้วัดเส้นดำ) ยังคงอยู่เหนือรูปแท่งเทียน (เป็นแนวโน้มขาขึ้น) ราคายังคงอยู่เหนือเส้นเท็คันเซน (เส้นสีแดง) และเส้นคิจุนเซน (เส้นสีเหลือง)

Alexandros Yfantis 16:27 2023-11-24 UTC+2

การวิเคราะห์ตัวบ่งชี้เมฆอีจิโมกุบนคู่สกุลเงิน EURUSD สำหรับวันที่ 24 พฤศจิกายน พ.ศ. 2566

EURUSD กำลังซื้อขายอยู่ที่ราวๆ 1.0936 ในเชิงฝนคลาวด์อิชิโมกู, แนวโน้มยังคงเป็นแบบการเงินในระยะสั้นๆ ตามที่ราคายังคงซื้อขายอยู่เหนือคลาวด์ (เมฆ) สแปนของ Chikou (สายตัวชี้วัดสีดำ) ยังคงอยู่เหนือรูปแบบแท่งเทียน (ลักษณะการเงินที่ดี) โทเคนเส็น (สายตัวชี้แดง) และคีจันเส็น

Alexandros Yfantis 16:24 2023-11-24 UTC+2

วิเคราะห์ตัวชี้วัดเมฆอิชิโมกุใน USDJPY สำหรับวันที่ 23 พฤศจิกายน พ.ศ. 2566

USDJPY กำลังซื้อขายรอบ 149.62 ราคาถอนกลับมาใกล้ Kumo รายวัน (เมฆ) และพบการสนับสนุน ปัจจุบันราคากำลังกระเด็นกลับขึ้นสู่ kijun-sen (เส้นสีเหลืองตัวชี้วัด) และ tenkan-sen (เส้นสีแดงตัวชี้วัด) ทั้งสองตัวชี้วัดพบรอบ

Alexandros Yfantis 16:21 2023-11-23 UTC+2
หากไม่สะดวกคุยในตอนนี้
ระบุคำถามไว้ได้ใน แชท.
Widget callback
 

Dear visitor,

Your IP address shows that you are currently located in the USA. If you are a resident of the United States, you are prohibited from using the services of InstaFintech Group including online trading, online transfers, deposit/withdrawal of funds, etc.

If you think you are seeing this message by mistake and your location is not the US, kindly proceed to the website. Otherwise, you must leave the website in order to comply with government restrictions.

Why does your IP address show your location as the USA?

  • - you are using a VPN provided by a hosting company based in the United States;
  • - your IP does not have proper WHOIS records;
  • - an error occurred in the WHOIS geolocation database.

Please confirm whether you are a US resident or not by clicking the relevant button below. If you choose the wrong option, being a US resident, you will not be able to open an account with InstaForex anyway.

We are sorry for any inconvenience caused by this message.